Market Overview: Bitcoin Futures
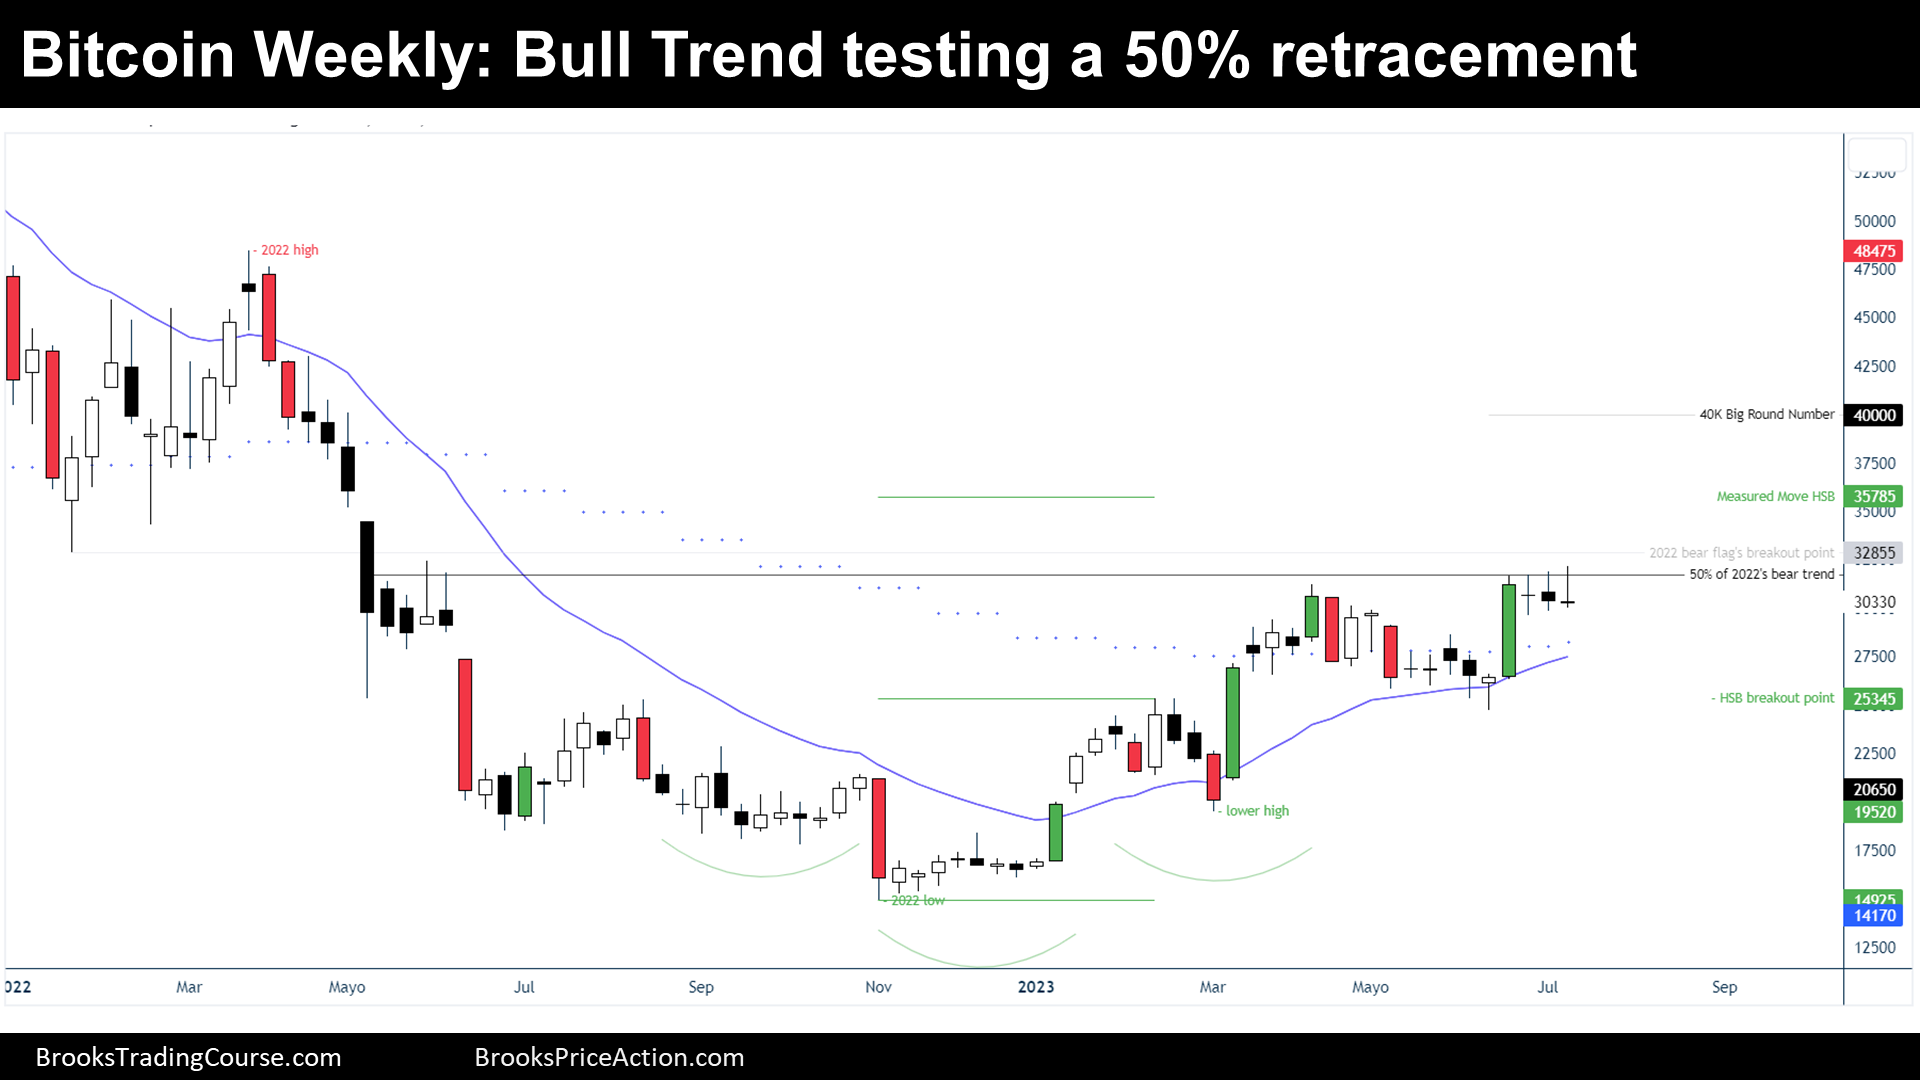
Bitcoin futures failing to close above 50 percent retracement of the 2022’s bear trend. During the week, the value of a Bitcoin decreased 0.23%. For 3 consecutive weeks, the price tested above the prior week’s high (wedge top within lower time frames). Traders want to see what happens if bears can close the gap of the bull flag’s breakout point at around $28700.
Bitcoin futures
The Weekly chart of Bitcoin futures

Analysis
- This week’s candlestick is a bear reversal bar with a tiny bull body. It is failing to close above 50 percent retracement.
- This year, the price was in a bull trend: higher lows and higher highs.
- When the market cycle is a bull trend, the probability is that it will continue in trending higher.
- Furthermore, when the market cycle changes, it will probably be into a trading range, instead of a bear trend or a bull breakout of the current bull channel.
- At any moment that there is a reversal down, traders should expect buyers below prior higher lows, specially at major higher lows like the one around $19500.
- The price will most likely hold the $20000 big round number if there is a reversal down.
- Now, the price is stalling around $32000, and it is failing to close above 50 percent retracement of 2022’s bear trend.
- Bulls:
- They want to continue the bull trend and achieve their bull targets:
- Head and Shoulders Bottom (HSB) Measured Move (MM).
- Ultimately, the 2022’s high.
- If the price returns to the HSB breakout point, they will still expect a reversal up and a resumption of the bull trend.
- Their bull trend thesis is only over if the price goes sideways for a long time, or if the price trades at the major higher low.
- They want to continue the bull trend and achieve their bull targets:
- Bears:
- The price is failing to close above 50 percent retracement, and hence, they think that a reversal down from here might be underway.
- The price needs to close the gap between the price and the bull flag’s breakout point at around $28700, to lower the bull strength.
- The best that bears can expect is a trading range instead of a bear trend.
Trading
- Swing Bulls:
- A bear doji with a bull body, it is not a good buy signal bar. Moreover, the price it is failing to close above 50 percent resistance. The Bulls should wait.
- The swing bulls who bought the bull signal three weeks ago will probably hold their trade because the bull trend can perfectly continue.
- However, reducing the position size by half below the current week’s low might be a good risk management strategy, since the price it is reversing down and this might present a future opportunity to buy lower.
- Swing Bears:
- They view this like a Low 1 while failing to close above 50 percent resistance. But it has never been a high probability trade to sell while the price comes from higher lows and higher highs. Hence, it is a low probability trade.
- Moreover, the next market cycle will probably be a trading range and not a bear trend, which means that the downside potential is not promising, at least nowadays. A neutral to low probability trade with a bad risk reward ratio is not attractive for bears.
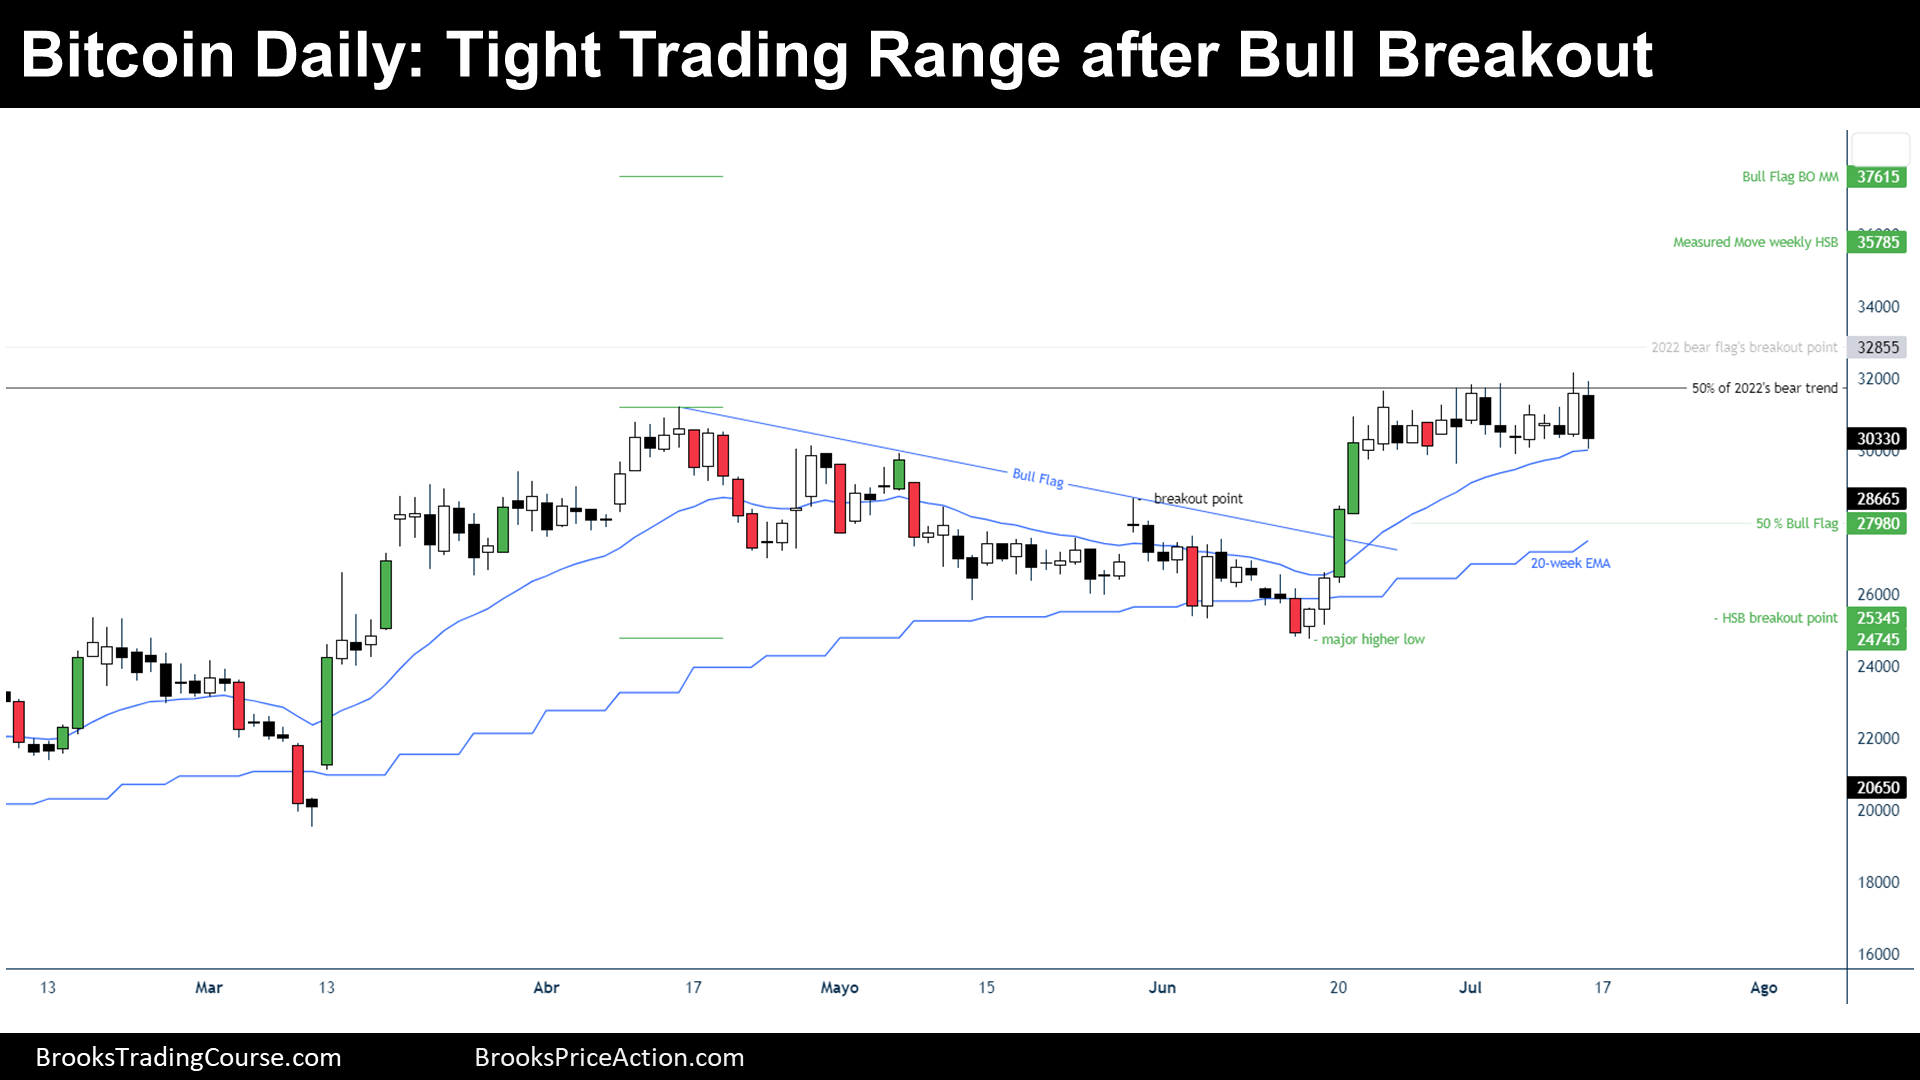
The Daily chart of Bitcoin futures

Analysis
- During the week, Bitcoin continued within a tight trading range after June’s bull breakout.
- June’s bull breakout was strong, traders expected a channel after such a spike. Instead, a tight trading range followed. Moreover, the tight trading range formed a wedge top.
- After a wedge top, what normally follows is two legs sideways to down: traders expect a low 2 and a high 2 setup to create soon.
- Bulls:
- They still expect a bull trend, but now they think that the price might go down first to find more buyers.
- Ultimately, they want to continue up until a 1:1 of the bull flag size is reached.
- Bears:
- They need a bear breakout of the tight trading range or consecutive bear bars before selling.
- Want closes below the bull flag’s breakout point, which means consolidate below the buy zone.
- Ultimately, they would like to get down to the bull breakout’s low, which will invalidate the spike and channel thesis.
Trading
- Swing bulls:
- They still believe that the june’s bull breakout will play a role. Hence, they look for ways to buy:
- Wait for a good bull signal bar after a high 2 setup.
- Consecutive bull bars.
- Bull breakout of the tight trading range.
- Buy at a 50% retracement of the bull breakout.
- The stop loss is the same, a tick below the bull breakout.
- They still believe that the june’s bull breakout will play a role. Hence, they look for ways to buy:
- Swing bears:
- They see a wedge top and a good bear bar, but they should wait since the price it is still above the 20-day Exponential Moving Average and anything within the June’s bull breakout is a buy zone.
- They need more sideways trading until traders forget June’s bull breakout.
- Or a strong bear breakout, and get down to the major higher low to end the bull thesis.
- They see a wedge top and a good bear bar, but they should wait since the price it is still above the 20-day Exponential Moving Average and anything within the June’s bull breakout is a buy zone.
Market analysis reports archive
You can access all weekend reports on the Market Analysis page.