Market Overview: FTSE 100 Futures
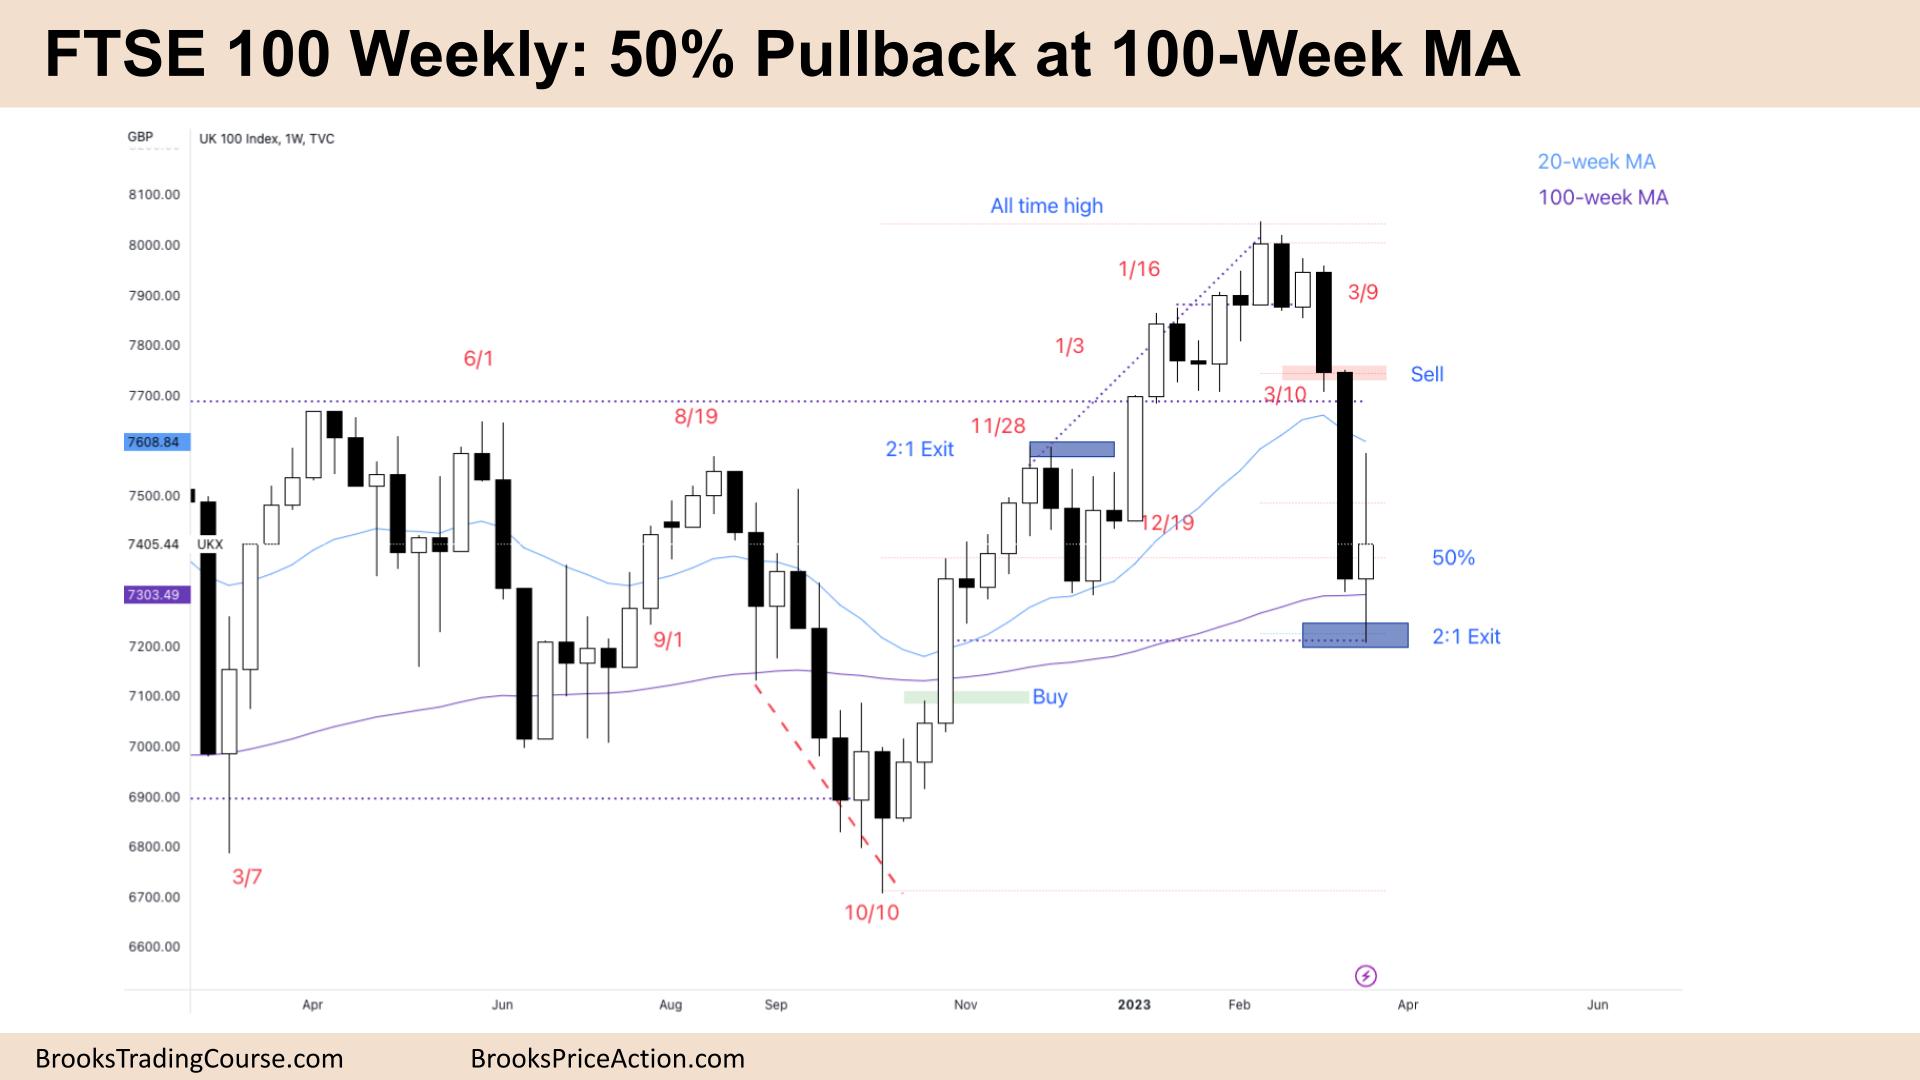
The FTSE futures market reached a 50 percent pullback last week after two big sell climax weeks. We went sideways with buyers below at the 100-Week MA and sellers up at the 20-week MA. Its not a great buy nor sell signal – but probably better to be short than long right now expecting a small second leg sideways to down.
FTSE 100 Futures
The Weekly FTSE chart

- The FTSE 100 futures market was bull doji with large tails above and below.
- The bulls see it as a 50 percent pullback from the rally’s start in October until now.
- It follows 2 large bear bars closing on their lows, so we are always in short. The last bear bar was huge and bigger than the others so it might have been the profit-taking sell climax.
- But it makes you consider a second follow-through leg after it.
- The bulls see a sell climax and are looking for a High 1 or High 2 buy to get in again.
- The 100-Week Moving average (MA) has been support for a few years, so many longer-term investors will accumulate there. That’s probably why we bounced so hard last week.
- We can see the buyers at the MA bought more lower and closed their first position at BE this week and a profit on their second position.
- That tells us limit bulls are making money so the bear leg is not as strong as it could be.
- The bears saw a bull channel and a wedge top and expected 2 legs sideways to down which they got. They scalped out at 50 percent.
- I’ve been saying since September last year that 7200 – the tight trading range seems to be important and we would come back here. The low of this week just touched back at it.
- That price could be the middle of a trading range. When the market has two important prices – the 8000 All Time High and the 7200 price – it often creates a third price of a measured move extension.
- That would be 800 points lower – 6600.
- That price is just below the October low, so we might get down there before continuing the trend. Or alternatively, spike up for a double top before visiting it again.
- The bulls want a buy signal, but this is not great for either side. There are probably many selers above – bulls needing to get out of losing positions. And also buyers below – bears needing to take windfall profits.
- Expect sideway to down next week as the market decides.
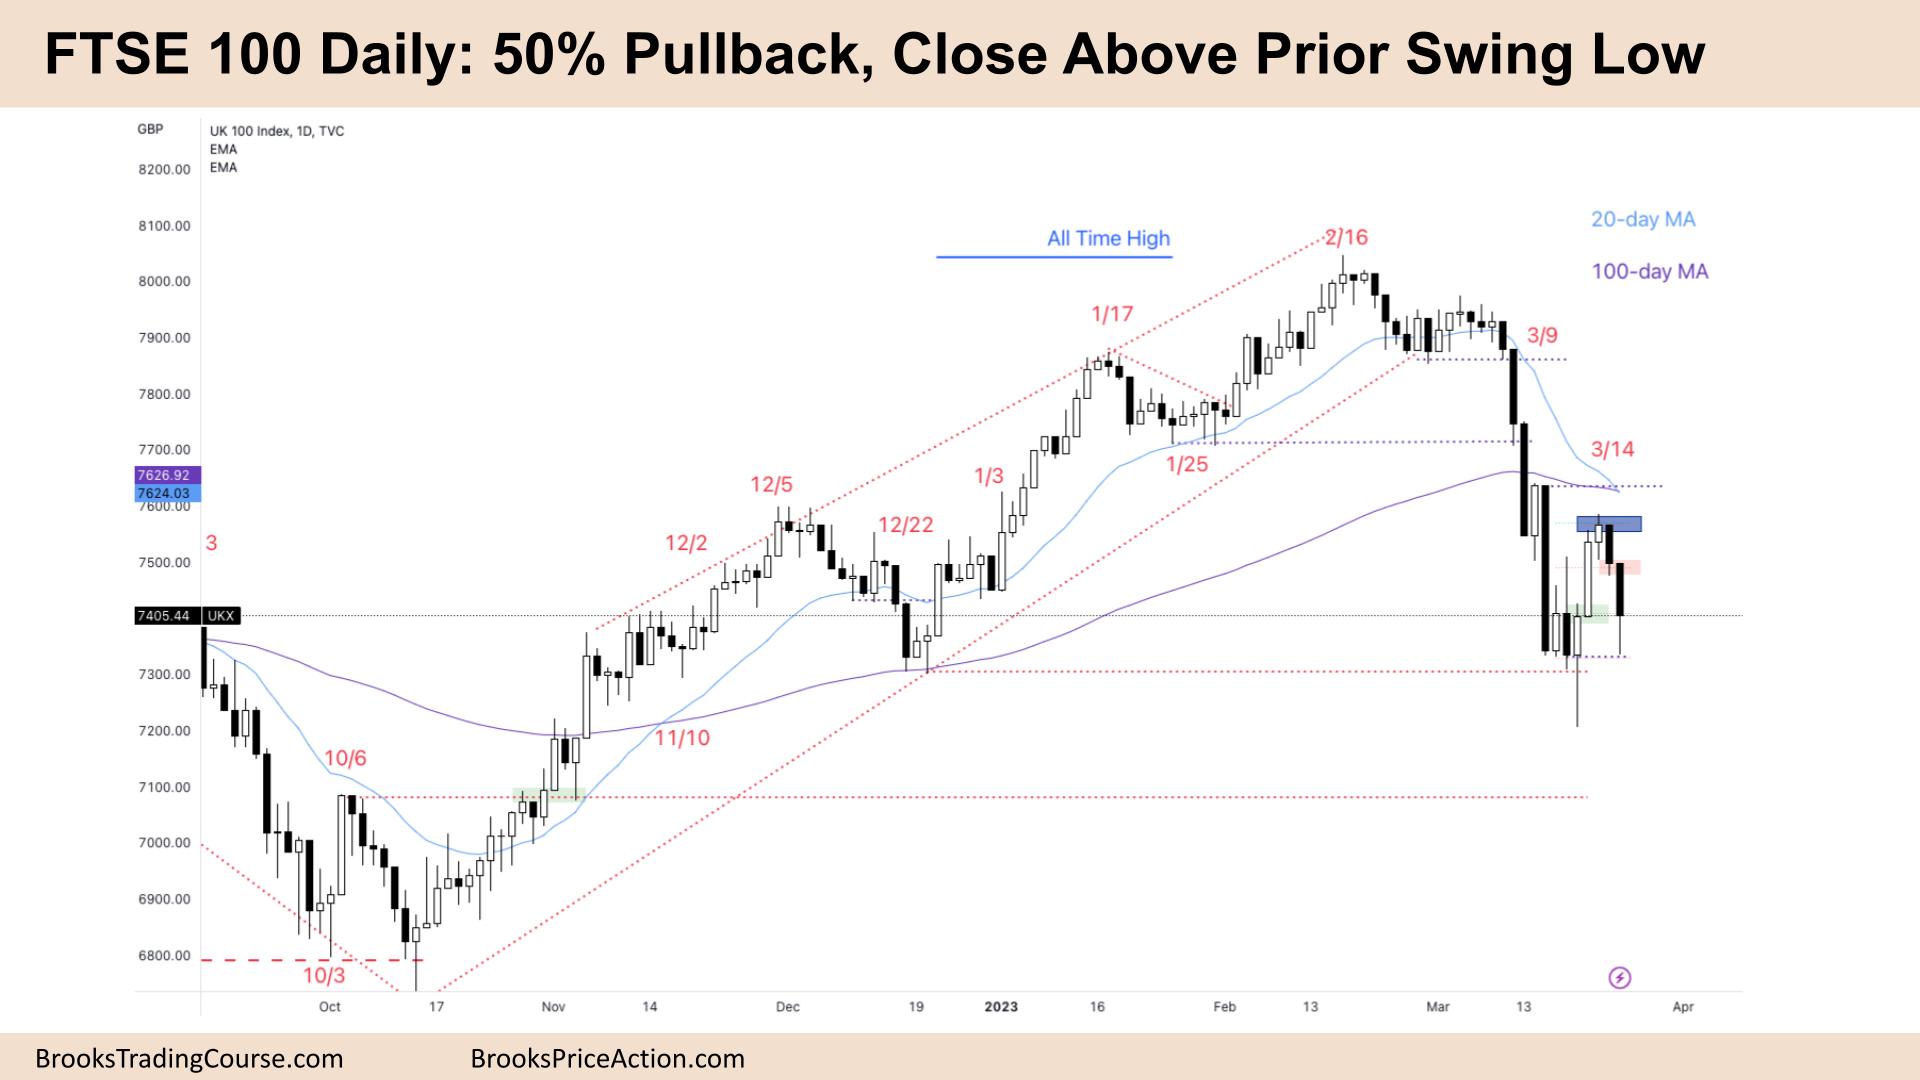
The Daily FTSE chart

- The FTSE 100 futures market was big bear bar closing below its midpoint with a large tail below.
- The bulls see a 50 percent pullback from the October rally and bought the High 2 above Monday which was a great day trade. They made 2:1.
- It is the second consecutive bear bar and it was a Low 2 sell below Thursday – they made 2:1.
- If both sides are making swings then we have probably entered a trading range.
- The bulls have been waiting for a pullback for many months but got trapped at many of the swing low points above – we might have to go back and let many of them out.
- The bears see a wedge top and expected two legs sideways to down. The second leg was much larger than the first.
- The bulls see a possible bear trap, a parabolic wedge bottom and you can see buy the buying pressure last week – 3 bull bars closing on their highs, that we might not go too much lower.
- Many bulls bought the close on March 14th so that is a magnet – it is also the 20-day moving average.
- If we get back there it would be a double top bear flag and a bear bar around there is a reasonable sell signal.
- After a bull trend for many months it is unlikely to reverse immediately so next week is likely sideways to down.
- The bears want some continuation selling – Monday will be important.
Market analysis reports archive
You can access all weekend reports on the Market Analysis page.

