Market Overview: FTSE 100 Futures
The FTSE futures market moved sideways-to-down last week with a bear inside bar. On the daily, we were up most of the week and dropped back on Friday. Classic trading range price action. Disappointing follow-through is a sign to scalp on these timeframes. That means the day session will have very different price action. We’re forming a larger triangle, so it is BOM and most traders should wait for a strong BO in either direction for a possible swing.
FTSE 100 Futures
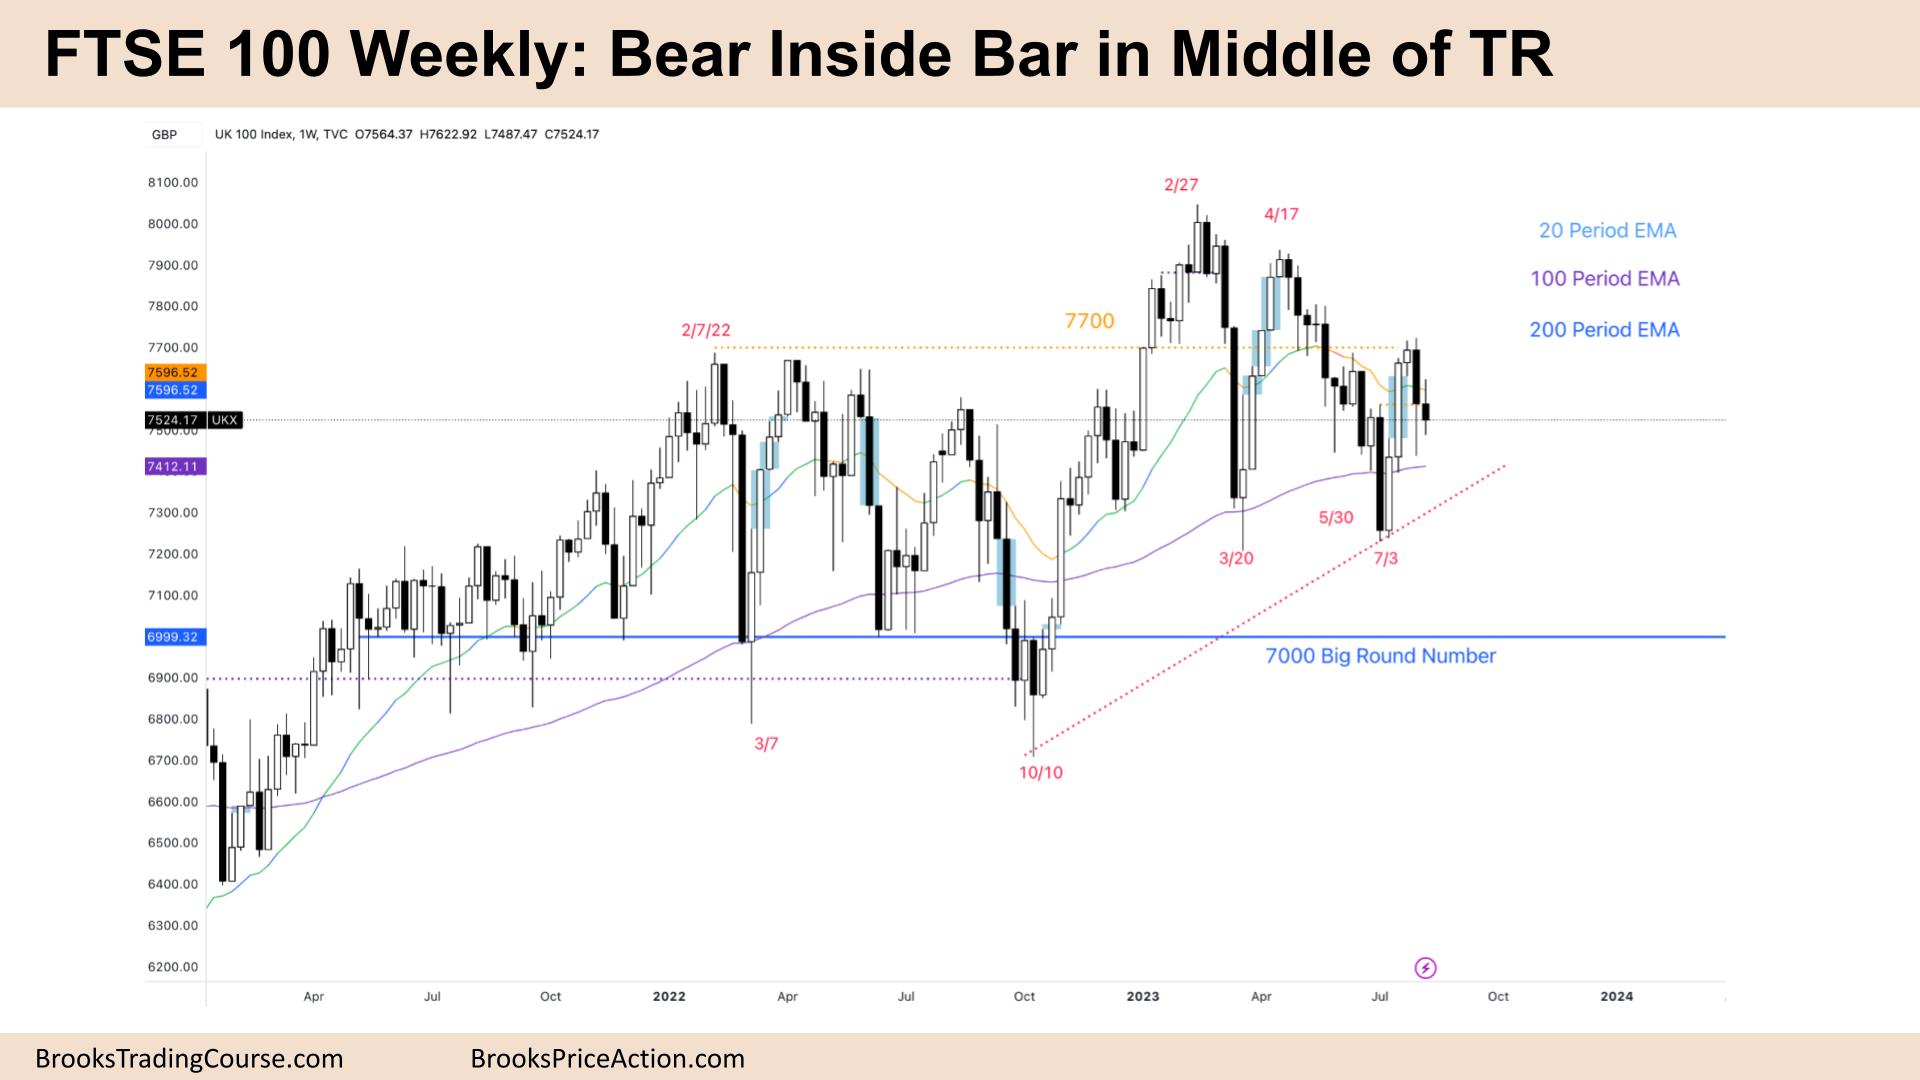
The Weekly FTSE chart

- The FTSE 100 futures last week was a small bear inside-bar with a tail below.
- It comes after the bear surprise bar last week at the test of the MA and was a pullback to the EMA in a fair tight bear channel.
- The bulls bought the 100-week EMA, and it became a HL DB with March.
- Some bulls see a BO of the TR, a HH and a deep two-legged pullback that runs along the prior bear channel line.
- Other bulls see a broad bull channel and expect the trading to be two-sided.
- This balance allows both bulls and bears to make money as they exit around the extremes – the channel lines.
- The bears might see the failed BO above a trading range and so expected two legs sideways to down.
- That probably finished last month, and most exited, allowing the bulls to resume control.
- The bulls got a small bull microchannel that tested the MA and the top of the last sell climax.
- It looks like we are now in BOM (Breakout Mode.)
- Bulls should get a second leg sideways to up, but the last two weeks are bad entry bars – likely limit order trading below the tails.
- It is OK to be long with a stop below the recent low. The bear inside bar will probably reverse if the bears get a BO here.
- Bears scaled in higher and had a chance to exit breakeven, which I think they should take. The last channel had many legs, so probably done.
- If it is a smaller trading range, you might get some bears looking to fade this BO for a test of the low – too many bull bars to be short. I’m looking for a long entry.
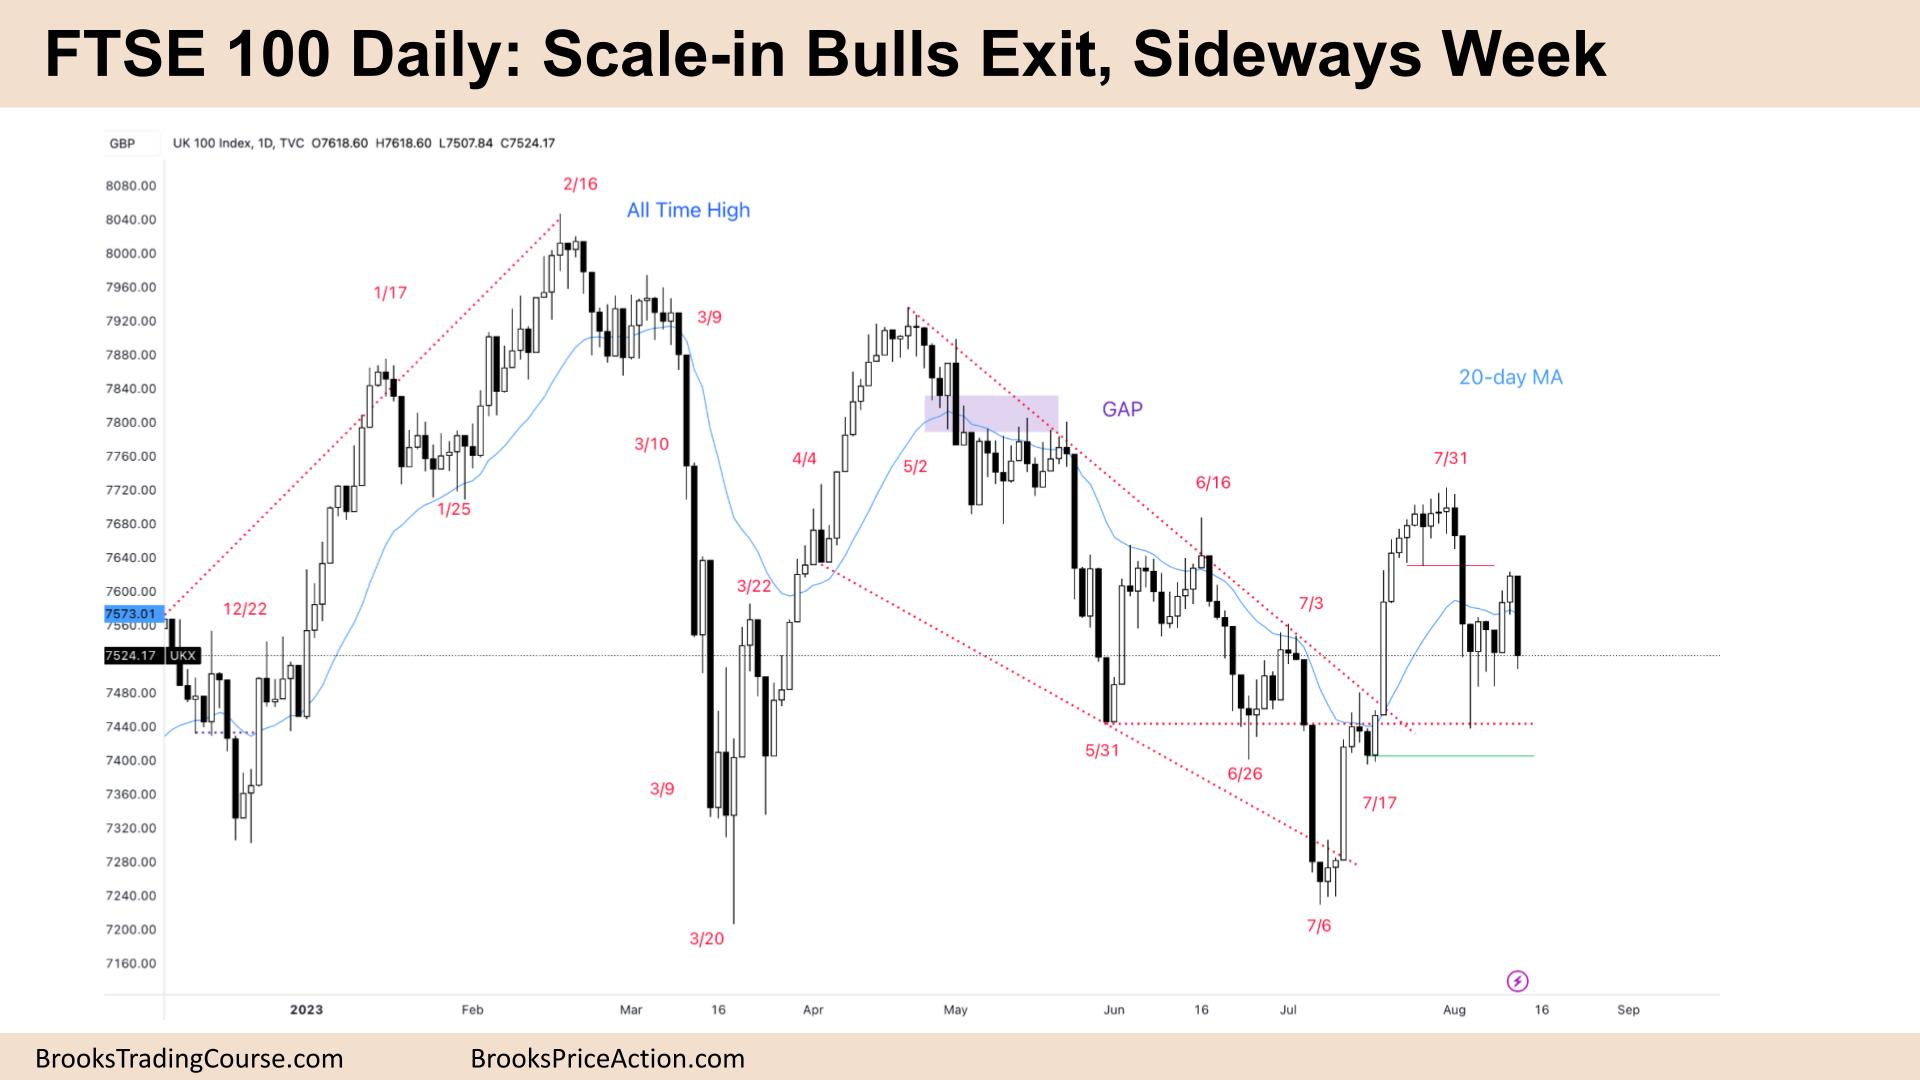
The Daily FTSE chart

- The FTSE 100 futures on Friday was a big bear bar closing near its low, so we might gap down on Monday.
- It is a bear surprise after 2 bull bars, and if it gets followthrough on Monday, it might get a second leg sideways to down.
- The bulls see a very strong bull breakout, a tight bull channel breaking out of a wedge bottom. Traders expect two legs up of a similar number of bars to the wedge – we haven’t had that yet.
- The bulls see this as the correction from leg one and want a similar-sized leg to follow. This leg looks like a fractal of the weekly chart.
- If you look at the fractals – we might get an inside bar on the daily – to correspond to the bear inside bar on the weekly.
- There is one open bull gap above, so we will probably get up there at some stage.
- The bears see lower highs and expected a trading range to follow the bear channel. The BO was strong and probably caught the limit traders off-guard who had to scale in at the gap above – they made money.
- We tested all the way back to the BO point of the wedge below – see the long tail.
- Now we are in the middle of the TR – an inside bar on the weekly, and so BOM.
- Both sides have cases to argue, which will probably lead to sideways trading. Expect the first BO to fail 50% of the time.
- Some bears will sell below this bar, expecting a 2nd leg down. Others will wait for the follow-through. Big bars often reverse.
- Its a bear inside bar on the HTF so traders should be careful of taking a swing entry too early.
- The location is bad for stop-entry traders – so if you do trade, look to scalp part of your position – most days have been reversing.
Market analysis reports archive
You can access all weekend reports on the Market Analysis page.