Market Overview: FTSE 100 Futures
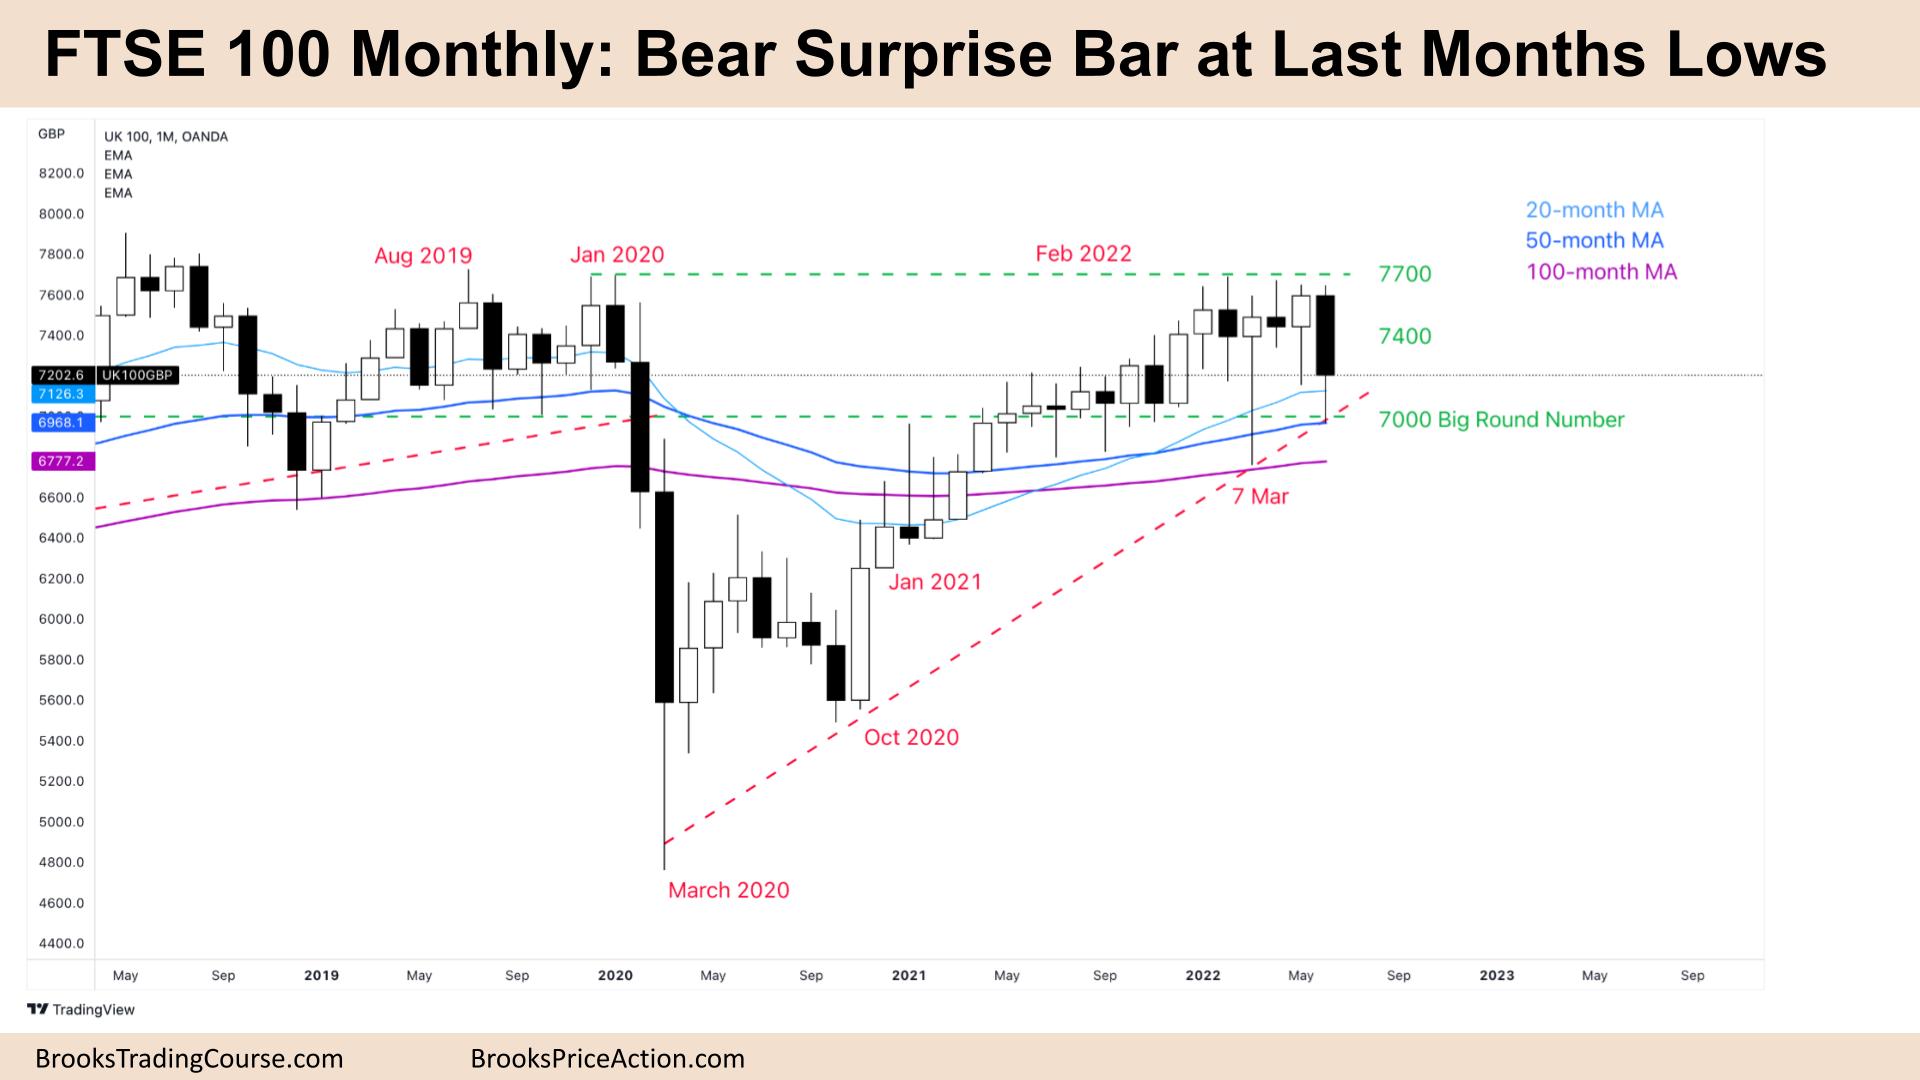
FTSE 100 bear surprise bar at last month’s lows. The bulls see a pullback in a relentless bull trend and a limit buy signal here and lower near the 7000 big round number. It is the first quarterly close lower since March 2020. The bears see a double top reversal from the top of a trading range and a pullback to keep working lower. Even though it was the largest bar for many months, it has a long tail below which suggests it is not as bearish as it seems.
FTSE 100 Futures
The Monthly FTSE chart

- The FTSE 100 futures was a bear surprise bar at last month’s lows and at the 20-Month MA.
- The bulls see a pullback from a 2-year bull trend and will look to scale into the High 1 buy, or even after a second leg lower with a moving average gap bar buy.
- They see we are pausing at the 7000 big figure and this might form the bottom of a trading range for the foreseeable future.
- The bulls know the best the bears can get after such a long trend is likely to be a trading range lasting the rest of the year.
- Bears see we have already been in a trading range, breaking out of a smaller, tighter trading range above.
- They see a micro double top and a lower high major trend reversal from the pre-pandemic highs.
- The bears have failed to get a close below the moving average for over 18 months so they know the first bar will be bought.
- It was a bad sell signal above, so we might need to go back up to get further sellers. They want this to be the start of a 2-legged move sideways to down and we might have had the first leg.
- You can see by the tails that bears were not holding swings short, so while they are scalping we will likely go sideways or back up to the tight trading range before traders decide.
- Bulls want a small inside bar to get a follow-through High 1 buy setup to test the highs, and they might get it. They know the bears have failed to get consecutive monthly bear bars for over 2 years so are likely to buy again next month.
The Weekly FTSE chart

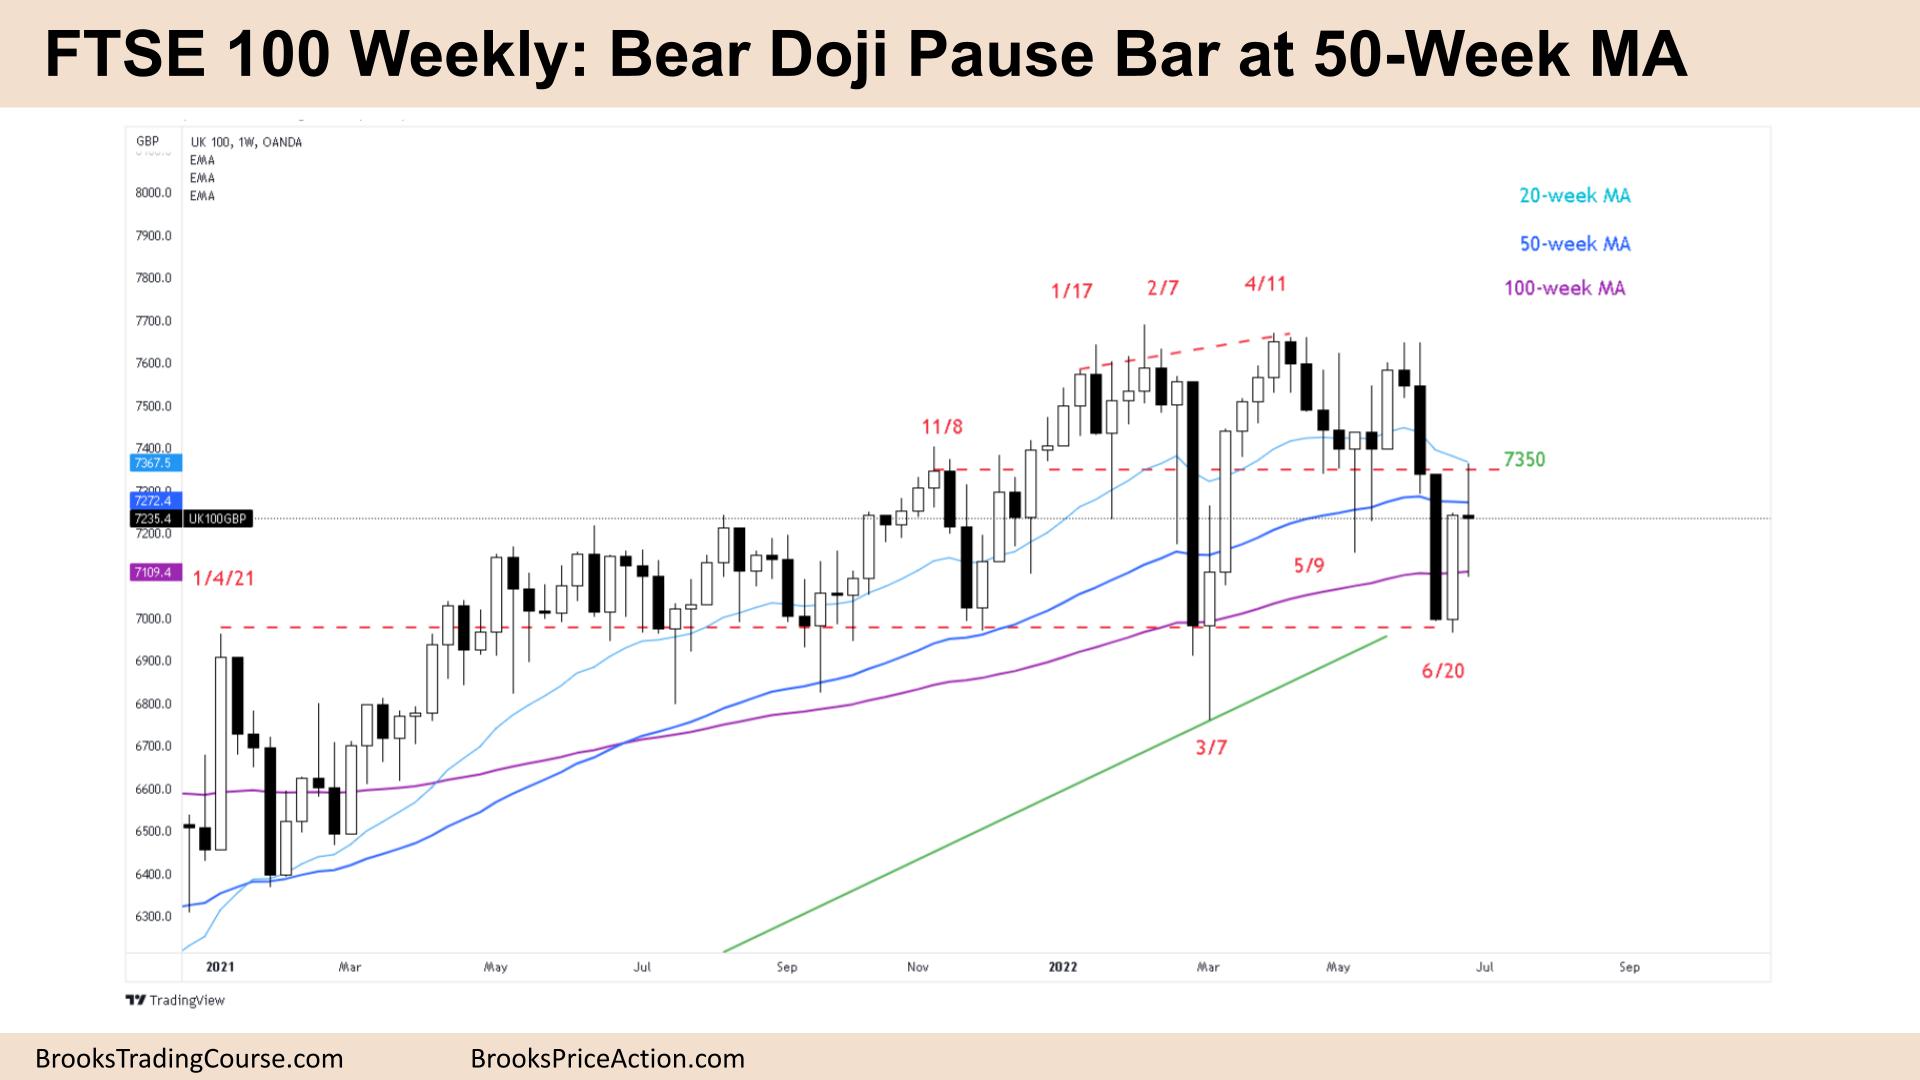
- The FTSE 100 futures weekly chart was a bear doji pause bar at the 50-week MA with large tails above and below.
- We said last week that both bulls and bears would expect a second leg down after 3 consecutive large bear bars closing below their midpoints. We might have had the second leg.
- The bulls see a High 1 off the bottom of a trading range with March 7th and the 7000 big round number. This has been support for 18 months and was resistance long before that, so the market might stay around here while traders decide.
- Bulls closed the gap and briefly touched the moving average. They want a follow-through bar back up to the tight trading range above, and we briefly touched that price last week.
- Even if they get a follow-through bar, it is likely bears are selling above this week scaling in for a test of March lows.
- The bears see a tight bear channel from a lower high major trend reversal. It’s a pullback so trading below this week will be a Low 1 continuation sell. But the math is bad if we are at the bottom of a trading range.
- The bears want a follow-through bar with a decent close next week to have a chance to get down to 7000. They want to avoid a double bottom, micro double bottom near there or bears will likely exit their shorts.
- If you look left, whenever we paused here on the weekly chart, we traded below and then finished higher as bears exited and bulls bought. So sideways to up next week.
Market analysis reports archive
You can access all weekend reports on the Market Analysis page.

