Market Overview: FTSE 100 Futures
The FTSE futures market moved lower last week with a bear surprise bar, and bears will want follow-through selling. The bulls see many legs and a higher-low with March. Traders have been buying the 100-week MA, so there is a natural long there. The bears will try and trap bulls there.
FTSE 100 Futures
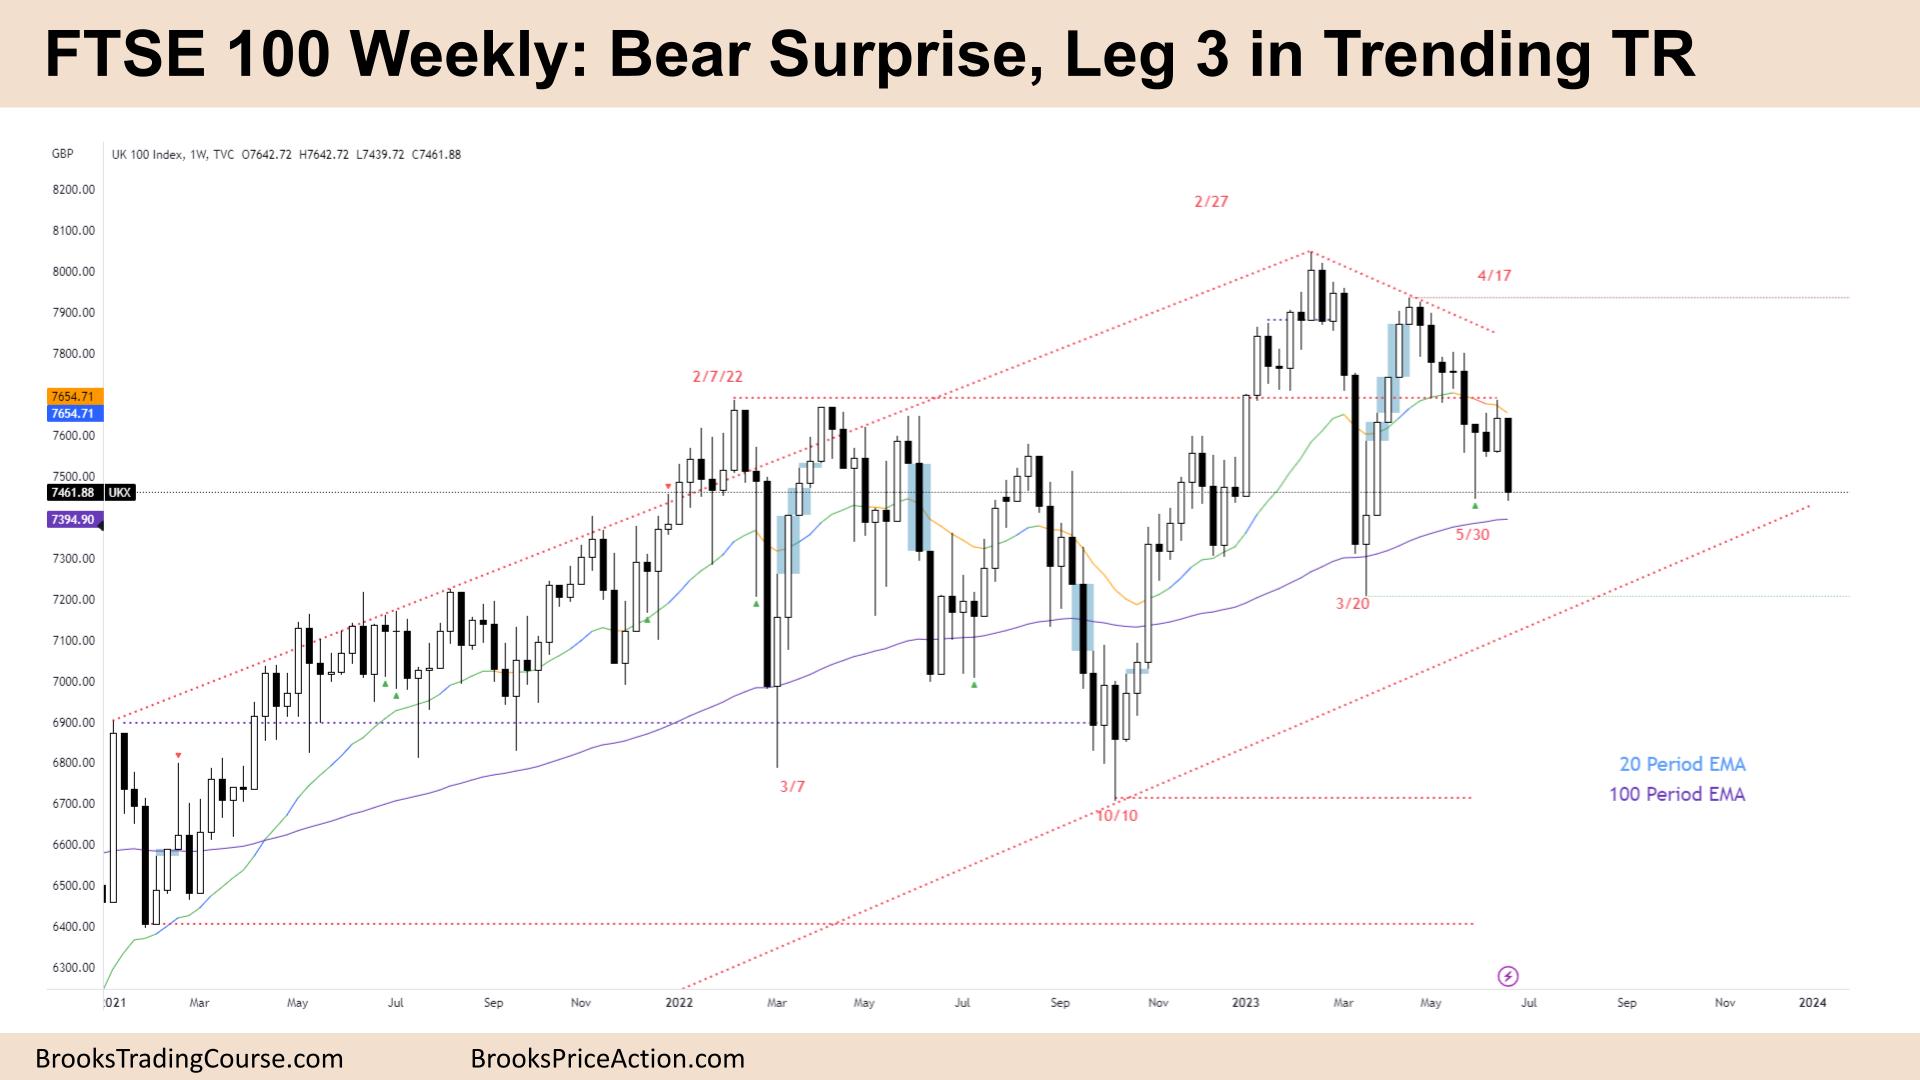
The Weekly FTSE chart

- The FTSE 100 futures experienced a big bear bar, a bear surprise, that closed at its low last week, indicating a potential gap down on Monday.
- There was a breakout from an 18-month trading range on the higher timeframe, but it lacked follow-through and resulted in a deep pullback.
- The pullback was to 50% of the last bull leg from October, bringing us to March. Since then, the market has attempted to form a higher-low between the two moving averages.
- The bulls see the potential for a new all-time high, followed by a pullback and a strong bull leg.
- They are looking for a higher low and a double bottom, but their attempts to set up a High 2 failed. Instead, they hope for a High 3 around the 100-week moving average as a potential buying opportunity.
- On the other hand, the bears see a trending trading range, a failed breakout above the all-time high, and a bearish surprise in March.
- They note that the two bear bars leading up to March 20th were disappointing, making it reasonable for bears to sell near the highs.
- Additionally, the bears identified a possible head and shoulders top with the right shoulder around April 17th.
- The bears see three pushes down, indicating that we are in the third leg. The coexistence of a bull swing and a bear swing can be explained by forming a triangle pattern from October to February.
- Triangles lack BOs in either direction suggesting a period of consolidation within the range.
- Given the presence of seven consecutive bear bars, it is likely that we are always in short.
- Traders were advised that if the market traded above the high of a prior bar, bears would sell, which indeed happened.
- Last week, the bears saw it as a bearish surprise and expect further follow-through.
- However, the bulls viewed last week as a climax bar, the strongest bar at the end of a move, and they can see that we reversed up and failed to break out below the low of May 30th.
- If one had to be in the market, after a bear surprise, it would be better to be short or flat.
- Bulls who bought last week got trapped and had to scale in below. They are now looking to break even.
- Despite the breakout from a higher timeframe trading range, the market is currently closing back inside that range, which is bearish.
- The upcoming week is crucial for bears as it may allow them to break below the March lows and potentially trigger a measured move down.
- The bull micro channel from March was strong, with bulls scaling in all the way down and stopping below the low of March 20th. Bears aim to hit those stops, establish a lower high at April 17th, and continue the move down.
- The sideways movement observed on March 20th, which acted as a magnet, may cause the market to return to that level.
- Drawing lines above and below the doji candle on that day, it becomes evident that we might need to spend more time in this tight trading range until a catalyst emerges.
- Traders should anticipate sideways to downward movement next week.
- Currently, there is no compelling reason to buy after the bear surprise.
- There are likely to be limit-order traders at the March 20th level, and it is a substantial bar within a trading range, so a pullback should be expected.
- The limit order sell-order would be above last week’s high, with a stop above it.
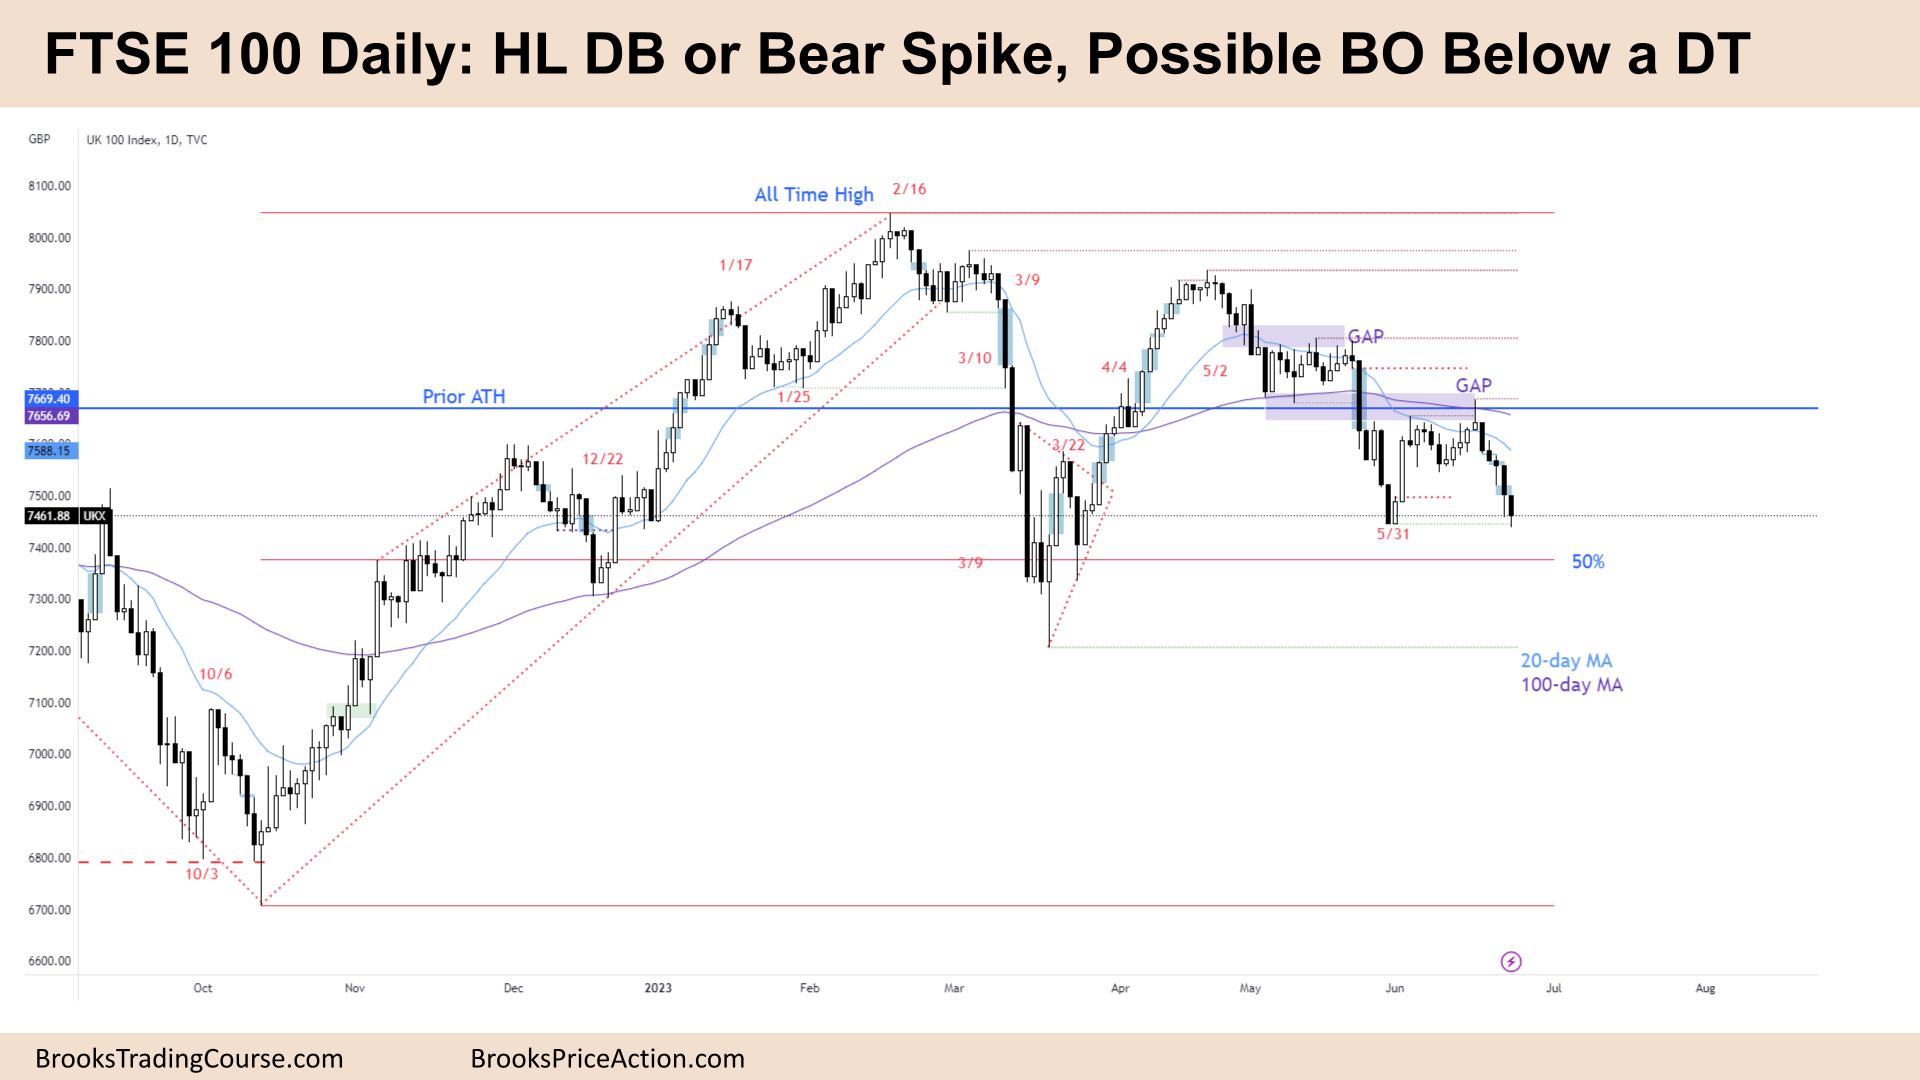
The Daily FTSE chart

- The FTSE 100 futures on the daily chart was a bear bar with a small tail on Friday, marking the fifth consecutive bear bar and a microchannel.
- As a result, the first reversal up is likely to be minor.
- Notably, the low on Friday, at 7439, did not breach the low of May 31st, which is unfavourable for the bears.
- The presence of three consecutive daily bars with significant tails below suggests that buyers are present, which indicates a potential formation of a trading range even if the market continues to move down.
- Bulls identified a potential double bottom in May, following a strong breakout from a triangle pattern.
- However, the subsequent deep pullback was disappointing, reducing their expectations of a higher low and an equal second leg.
- Instead, the market appears to be consolidating in a trading range.
- Currently, we are in the bottom one-third of the trading range, prompting bulls to consider buying at high twos and fading at low twos.
- Bears observed a bear spike down to the lows, setting up a potential double-top formation. They aim to break below the lows and initiate a measured move down, potentially surpassing the March lows.
- Additionally, two open gaps above are likely to act as targets for the bulls.
- The bulls aim to turn the situation into a wedge pattern if the market continues to move down. They know that the 50% retracement of the entire rally from October is just below the current levels.
- Traders also note the presence of a triangle pattern in March, which typically represents a tight trading range and an area of agreement.
- Consequently, traders should adopt a scalping strategy in this environment, focusing on quick profits by buying low and selling high.
- Next week, traders should anticipate sideways to downward movement. If the market trades above Friday’s high, a strong open micro gap indicates potential sellers at that level.
- The bulls also acknowledge that the bears have had multiple legs down, and the presence of strong bull bars in June suggests that there are likely buyers below who may scale in at lower levels.
Market analysis reports archive
You can access all weekend reports on the Market Analysis page.