Market Overview: FTSE 100 Futures
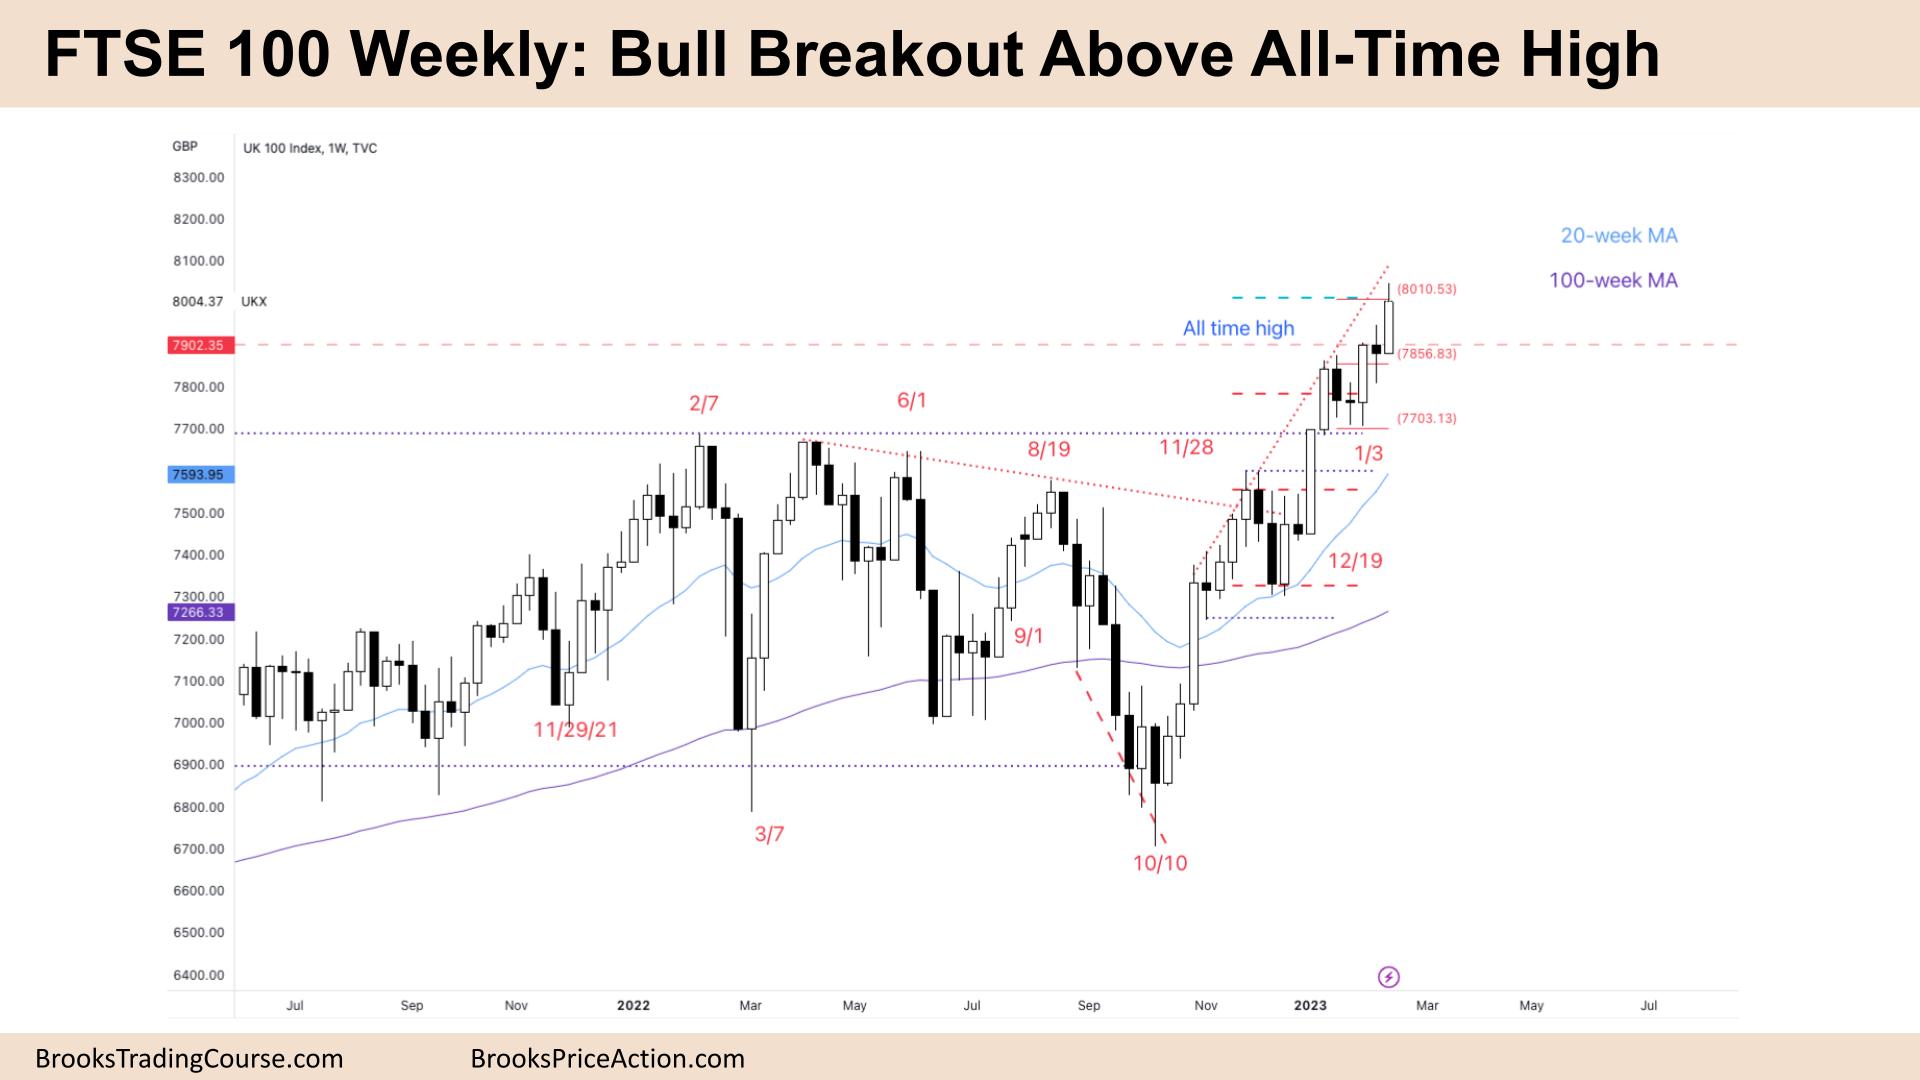
The FTSE futures market was a FTSE 100 big bull breakout above the all-time high. The bears have been unable to make money in this tight channel. The bears that sold the double top at the high of the trading range are now trapped and might force the price higher. The bears see the lack of consecutive weekly bull bars and know this is likely a leg in a trading range and a possible wedge top. Once the profit-taking begins, they will likely short heavily back to the breakout point of the trading range.
FTSE 100 Futures
The Weekly FTSE chart

- FTSE 100 big bull breakout above the All-time High.
- Last week was a bull bar with a small tail on top. The channel is tight with several pushes up.
- For the bulls, it’s a small pullback bull trend. We’re currently at a measured move target and above the moving average.
- Because we’ve had more than 20 bars above the moving average, bulls are likely to buy lower again.
- The bears see it as three pushes up, a possible wedge top and will look for two legs sideways to down, possibly to the moving average.
- It’s a bull bar, so it’s a buy signal and limit order bears have been unable to make money by selling new highs and selling higher. The pullbacks have not crossed the breakout points.
- If limit-order bears are not making money and stop-order bears are not, then the channel is tight. Traders should only be buying.
- We’re currently at a 2 to 1 swing target for the bulls from December, so we might see some profit-taking here. The lack of consecutive bull bars shows that speed and acceleration are decreasing.
- This means bulls have stopped buying above bars and are instead buying below bars. The bull breakout is slowing down.
- Two weeks ago was a small bear doji. So it’s a bad buy signal. There are likely buyers and sellers around the high of that doji, which would be a 50% pullback from this week.
- So we might go sideways before going up around the 8000 big figure.
- We are around the All-time High and might need to spend a few weeks here before traders decide whether we’re going for a measured move up or pulling back.
- The bulls want another bull bar to break above the All-time High and go for a measured move up. But it isn’t very clear. Which swing point would be the measured move?
- This channel might be too tight to break through, and we might need to form a trading range, perhaps down at the January breakout point, before going higher.
- The bears want a failed breakout above the All-time High and 8000 Big Figure. So They need a bear bar on the weekly and then a follow-through bear bar for traders to consider swinging short.
- Most traders should be long or flat.
The Daily FTSE chart

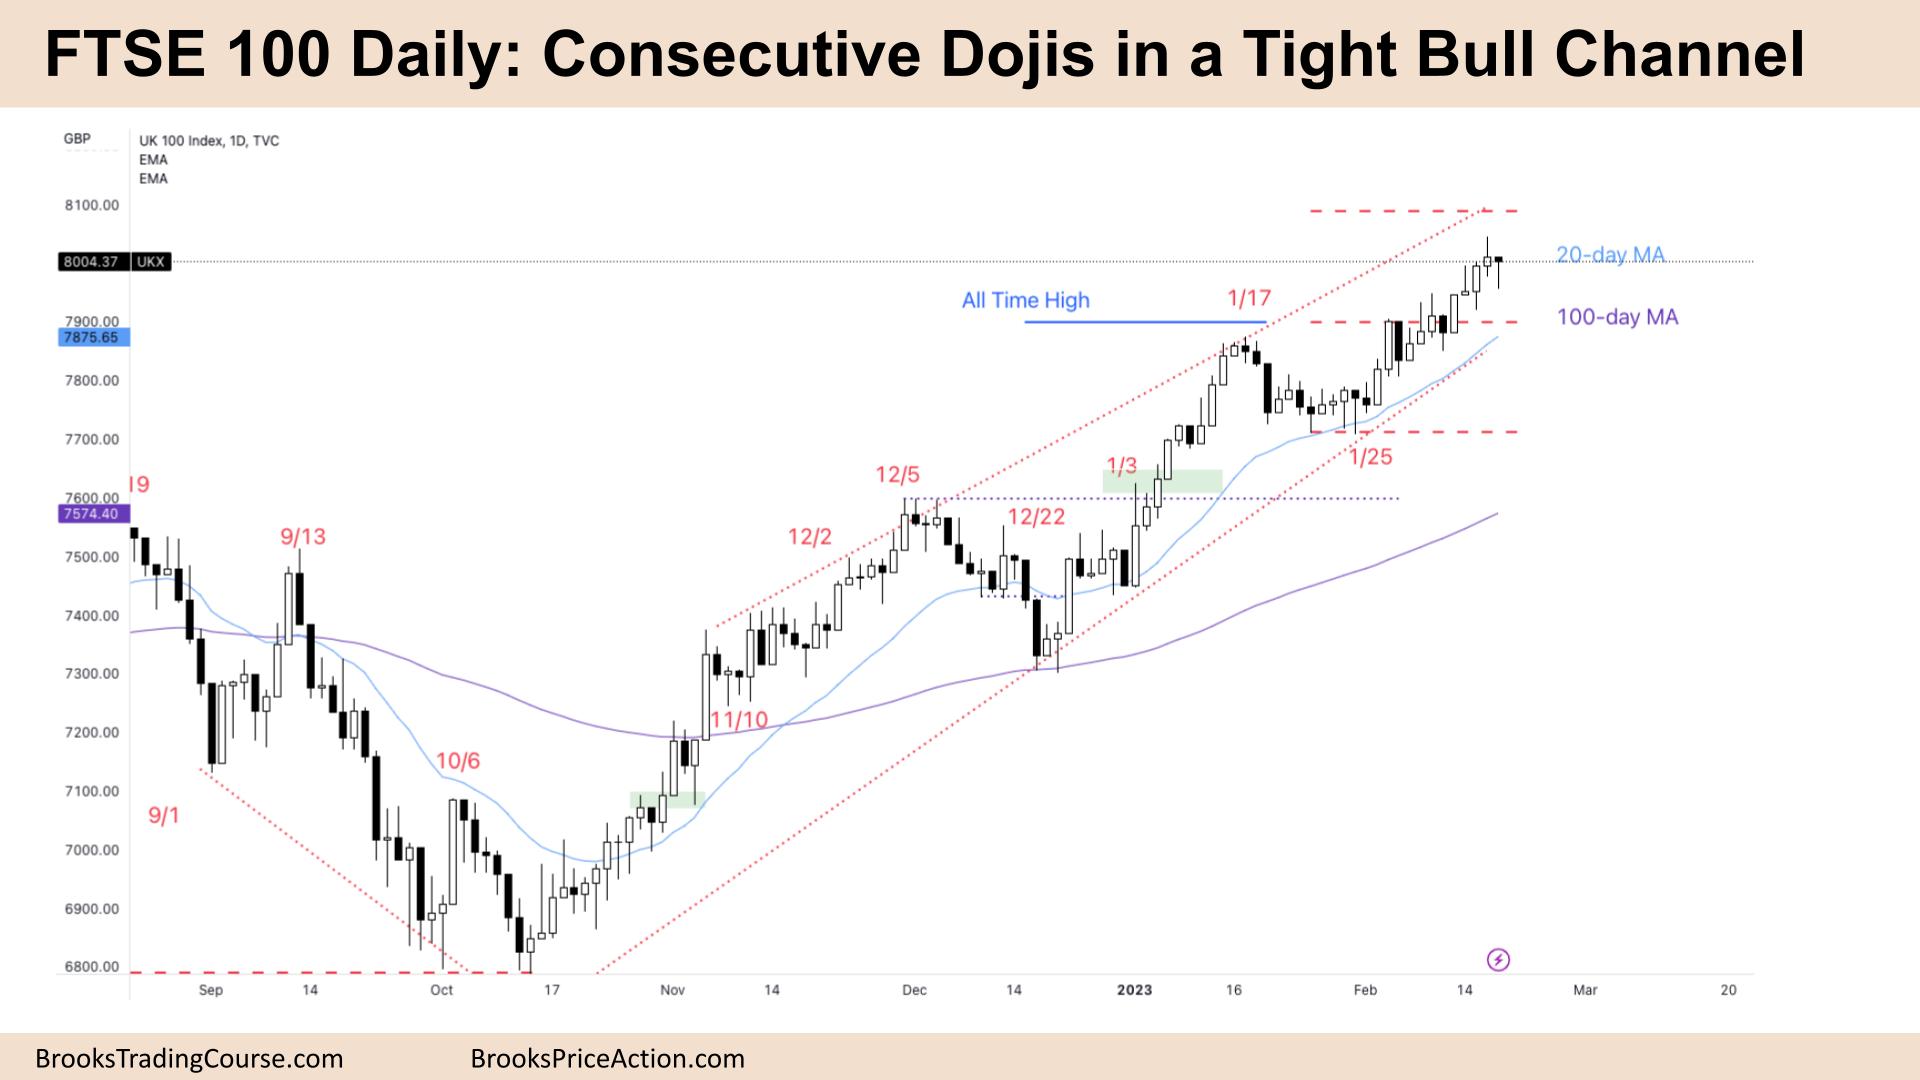
- The FTSE 100 futures was bear doji on Friday.
- It was a bear bar with a big tail below and no tail on top. Because it closed above its midpoint, some computers read it as a bull bar.
- The bar went below the low of Thursday, where limit-order bulls bought. Both stop-order and limit-order bulls are making money.
- The bulls see it as a tight bull channel, as the bears have been unable to get consecutive bear bars since January.
- The bears see it as a break above a wedge top, and they’re looking for a failed breakout to short.
- Both traders see the bars overlapping around the 8000 Big Figure after a bull breakout below.
- The bulls see the wedge top and a break above. They want a measured move from January 25th which would put the price around 8080.
- The bulls also see we’ve spent more than 20 bars above the moving average. So the next time we get back there, there are probably buyers.
- But this bull trend is starting to get climactic, and late acceleration in a trend can signal profit-taking and mean there’ll be a pullback soon.
- Friday was a bear bar, so technically it’s a Low 1, but it’s a bad sell signal, and it’s a bear bar, so it’s a bad buy signal.
- We’re likely to go sideways on Monday if the bears cannot get a second signal, a Low 2 short, then it will be a reasonable trade back to the moving average, testing the breakout point from the wedge top.
- The Bulls would like any pullback to stay above 7900, a test of the breakout point and set them up from a measured move higher.
- Most traders should be long or flat.
Market analysis reports archive
You can access all weekend reports on the Market Analysis page.

