Market Overview: FTSE 100 Futures
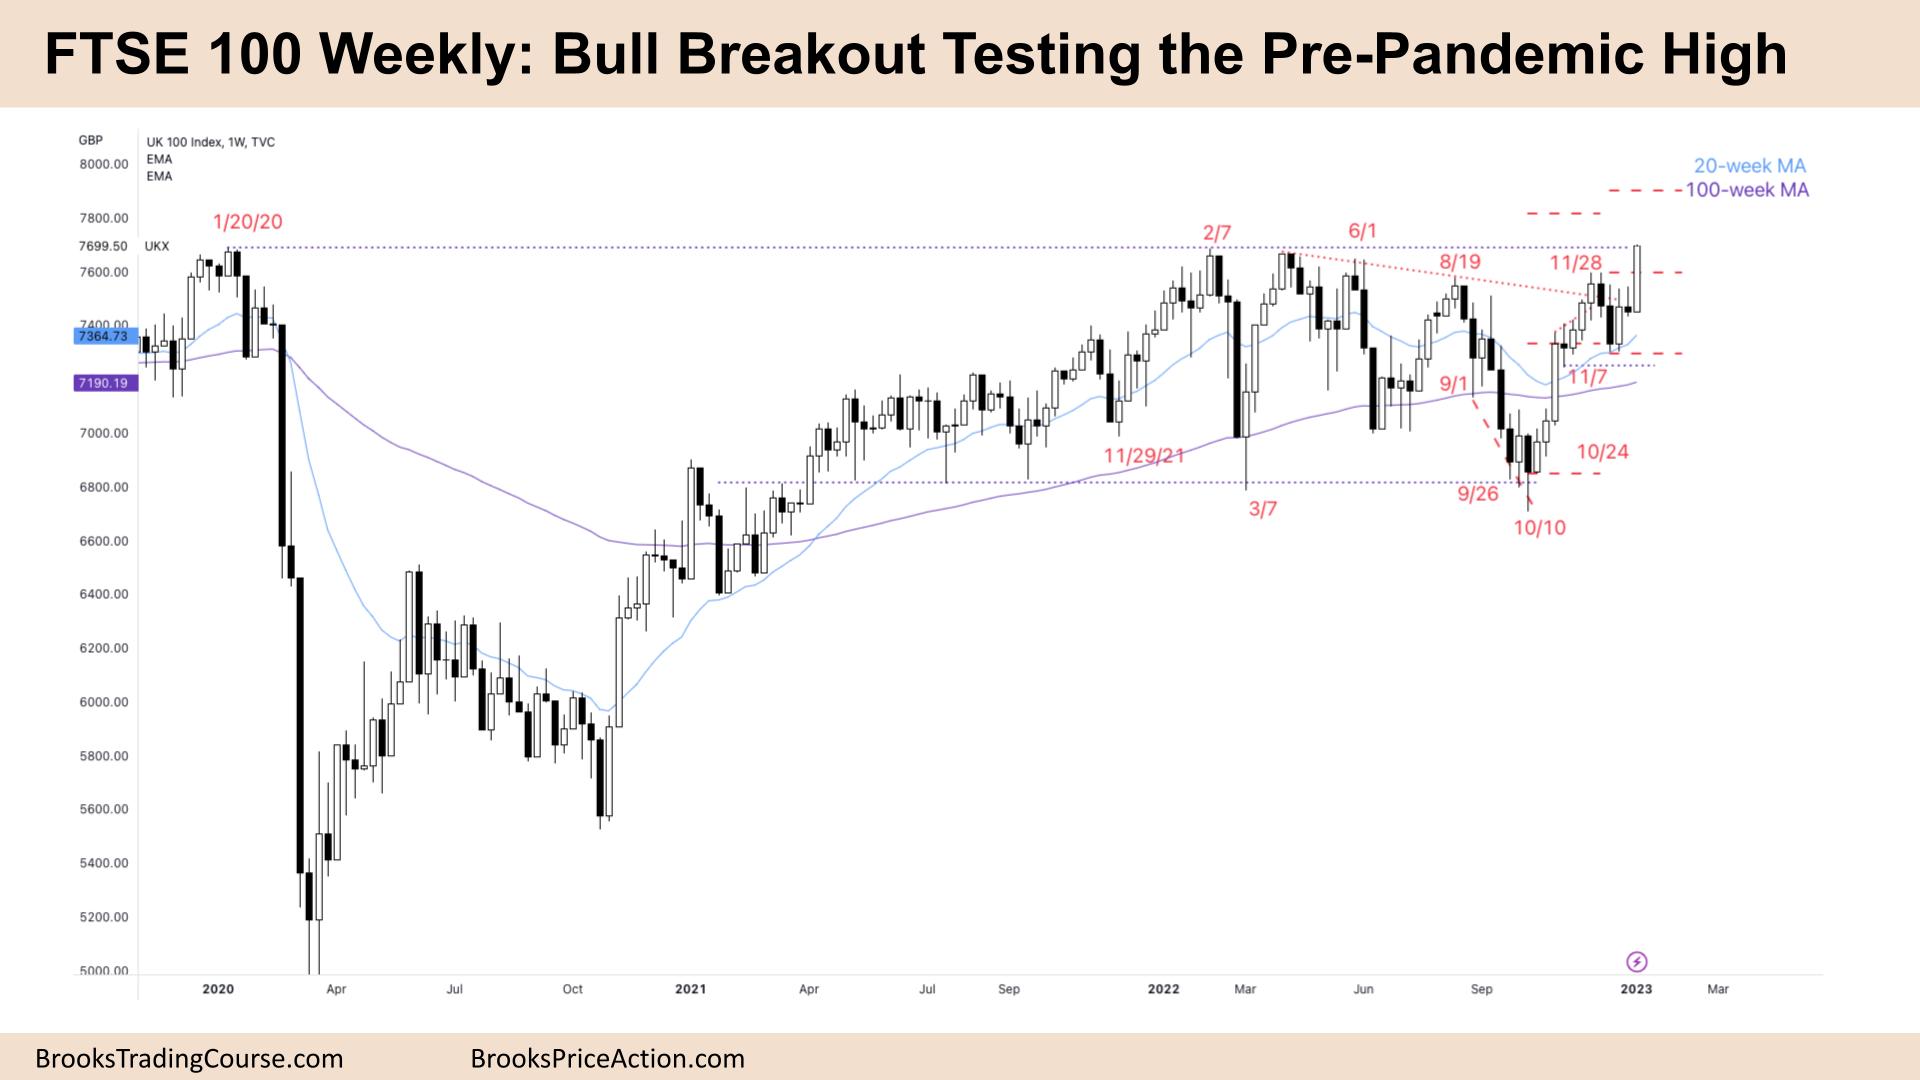
The FTSE futures market was a big bull breakout testing the pre-pandemic high. The bulls want this to be a bull flag of the post-pandemic bull run. But with several breakout attempts, traders wonder if this has increased or decreased probability. The bulls have measured move targets above. With such strong bear bars around this price, it is reasonable for limit bears to scale in higher betting we will reverse down below swing points, and they can make money also. Two-sided trading is the hallmark of a trading range.
FTSE 100 Futures
The Weekly FTSE chart

- The FTSE 100 futures was a big bull breakout bar closing on its high, so we might gap up next week.
- The bar is breaking above the trading range that lasted until 2022.
- We tested the pre-pandemic high on Jan 20th 2020, 3 years ago.
- A big bull bar is a breakout. The question is whether this is a measuring gap for a move up or an exhaustion gap for a reversal.
- Next week is important because traders will want to see follow-through.
- The bulls see a tight bull channel, pullback and second leg up. Because leg 1 was so strong, there might be three legs.
- Last week was a High 1 buy, but above a bear doji is not a high probability trade, we might need to test the high of last week before continuing.
- The bears see a buy climax and exhaustion gap and will look to sell a reversal. Limit order bears are likely at the high of the trading range betting that 80% of breakouts fail.
- The bar is the strongest late in a trend so this late acceleration could be a trap.
- The bulls want a follow-through bar next week, even a small doji, to give them the confidence of a measured move up. There are two targets on the chart for possible targets above.
- The bears see the close right on the prior high. They are looking for a bull trap, a small move above followed by a reversal. Some traders will sell the high and higher at the measured move targets.
- So far, there is nothing to sell for the bears.
- The bears want a higher high major trend reversal followed by a lower high major trend reversal.
- They see it all as a double top bear flag with a deep pullback from the pandemic high.
The Daily FTSE chart

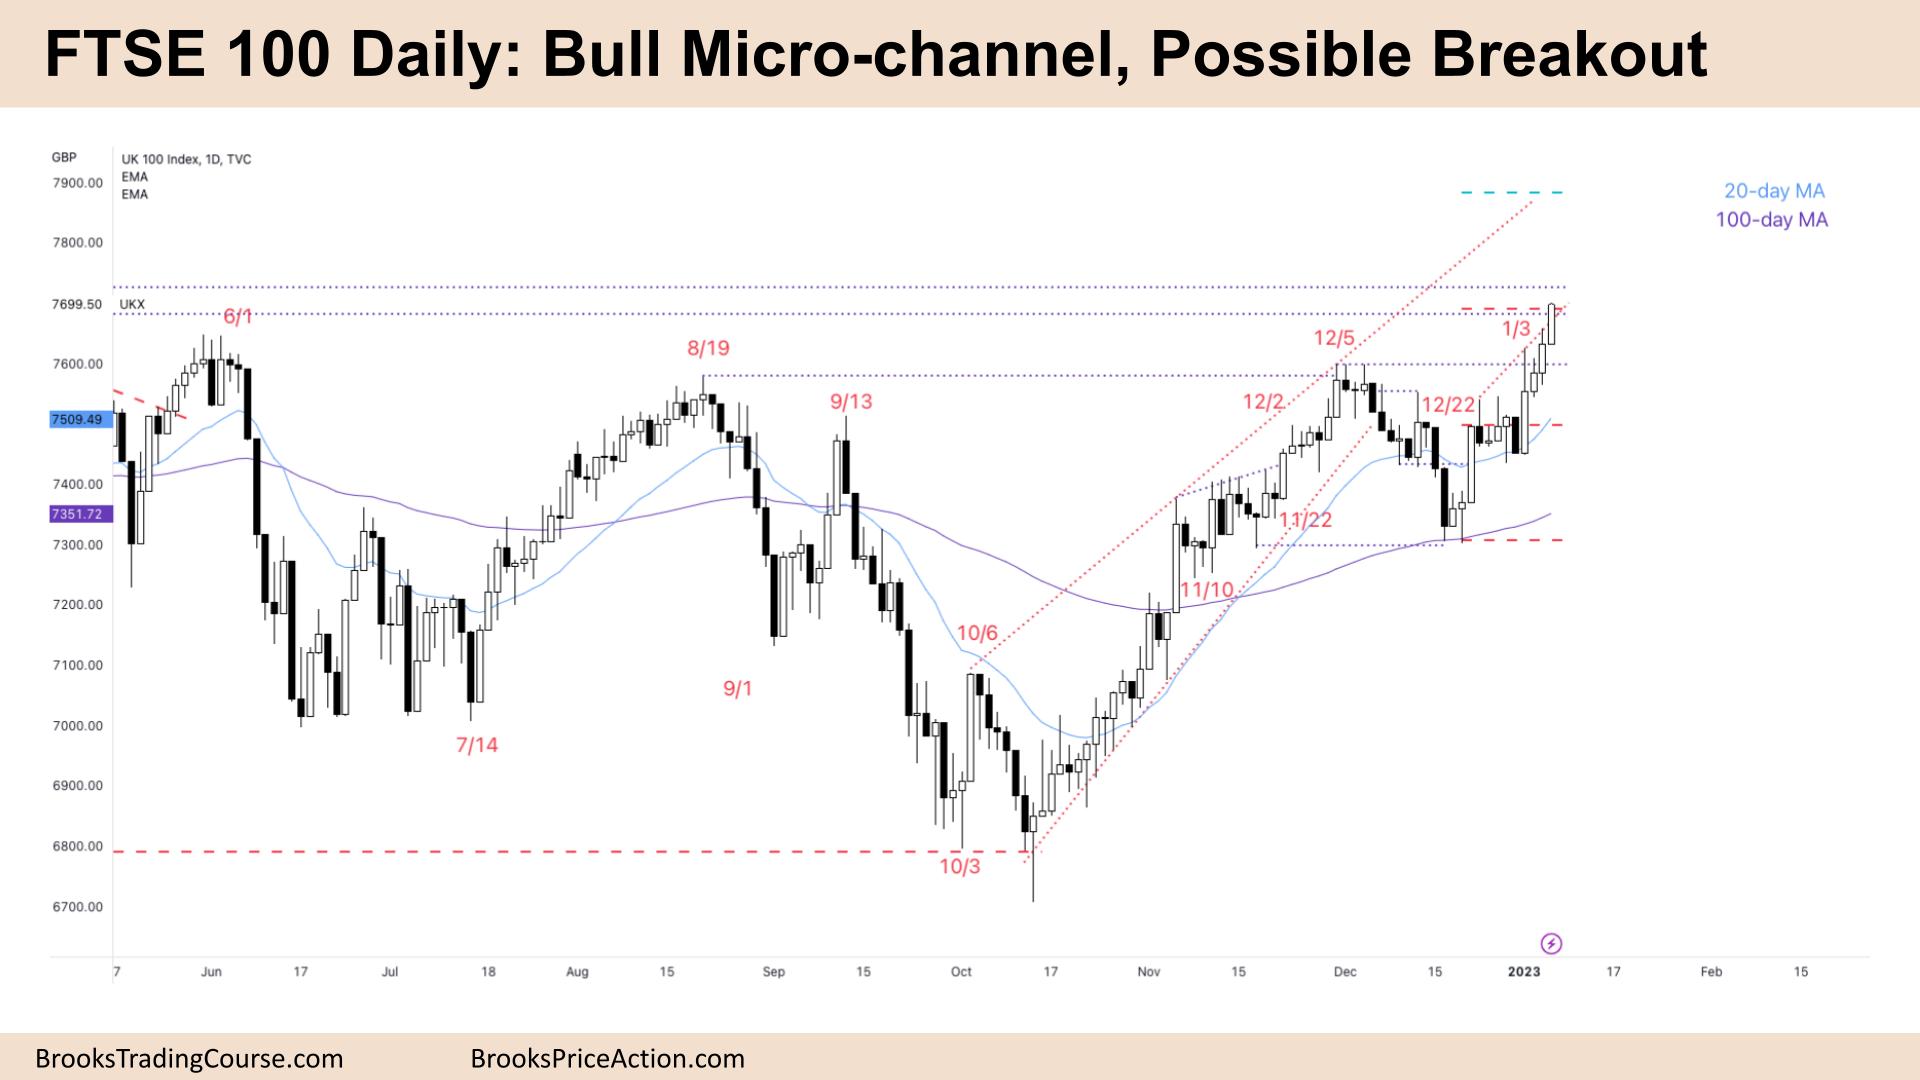
- The FTSE 100 futures was big bull breakout bar closing on its high on Friday, so we might gap up on Monday.
- It is the 4th consecutive bull, a 4-bar bull micro channel. The first bar to go below the low of a prior bar will likely attract buyers.
- The bulls see we broke out above the Dec 5th / Aug 19th high, and they want a measured move up, and they might get it.
- The channel has been relatively tight for three months, with less than three days under the 20-day EMA. That buying is relentless and a small pullback bull trend on a higher timeframe.
- The bears see a trading range, and we are reaching the top of the 3-year range. They know the math favours selling prior highs and betting on failed breakouts. Scale in bears will sell and sell higher, betting the channel will weaken over time.
- That makes this last bull leg interesting – the speed and acceleration have increased. When late legs are stronger than prior legs, they often attract profit-taking.
- The bears might see this as a parabolic wedge – Dec 12th, Jan 3rd and look to swing a reversal down. Currently, there is nothing for them to sell.
- We are always in long, so better to be long or flat. Always-in traders will exit below a bear bar, closing below its midpoint.
- Bulls see the first leg of October – December as a leg on a higher timeframe and want a harmonic of that move. That would put us at the all-time high near 7900.
Market analysis reports archive
You can access all weekend reports on the Market Analysis page.