Market Overview: FTSE 100 Futures
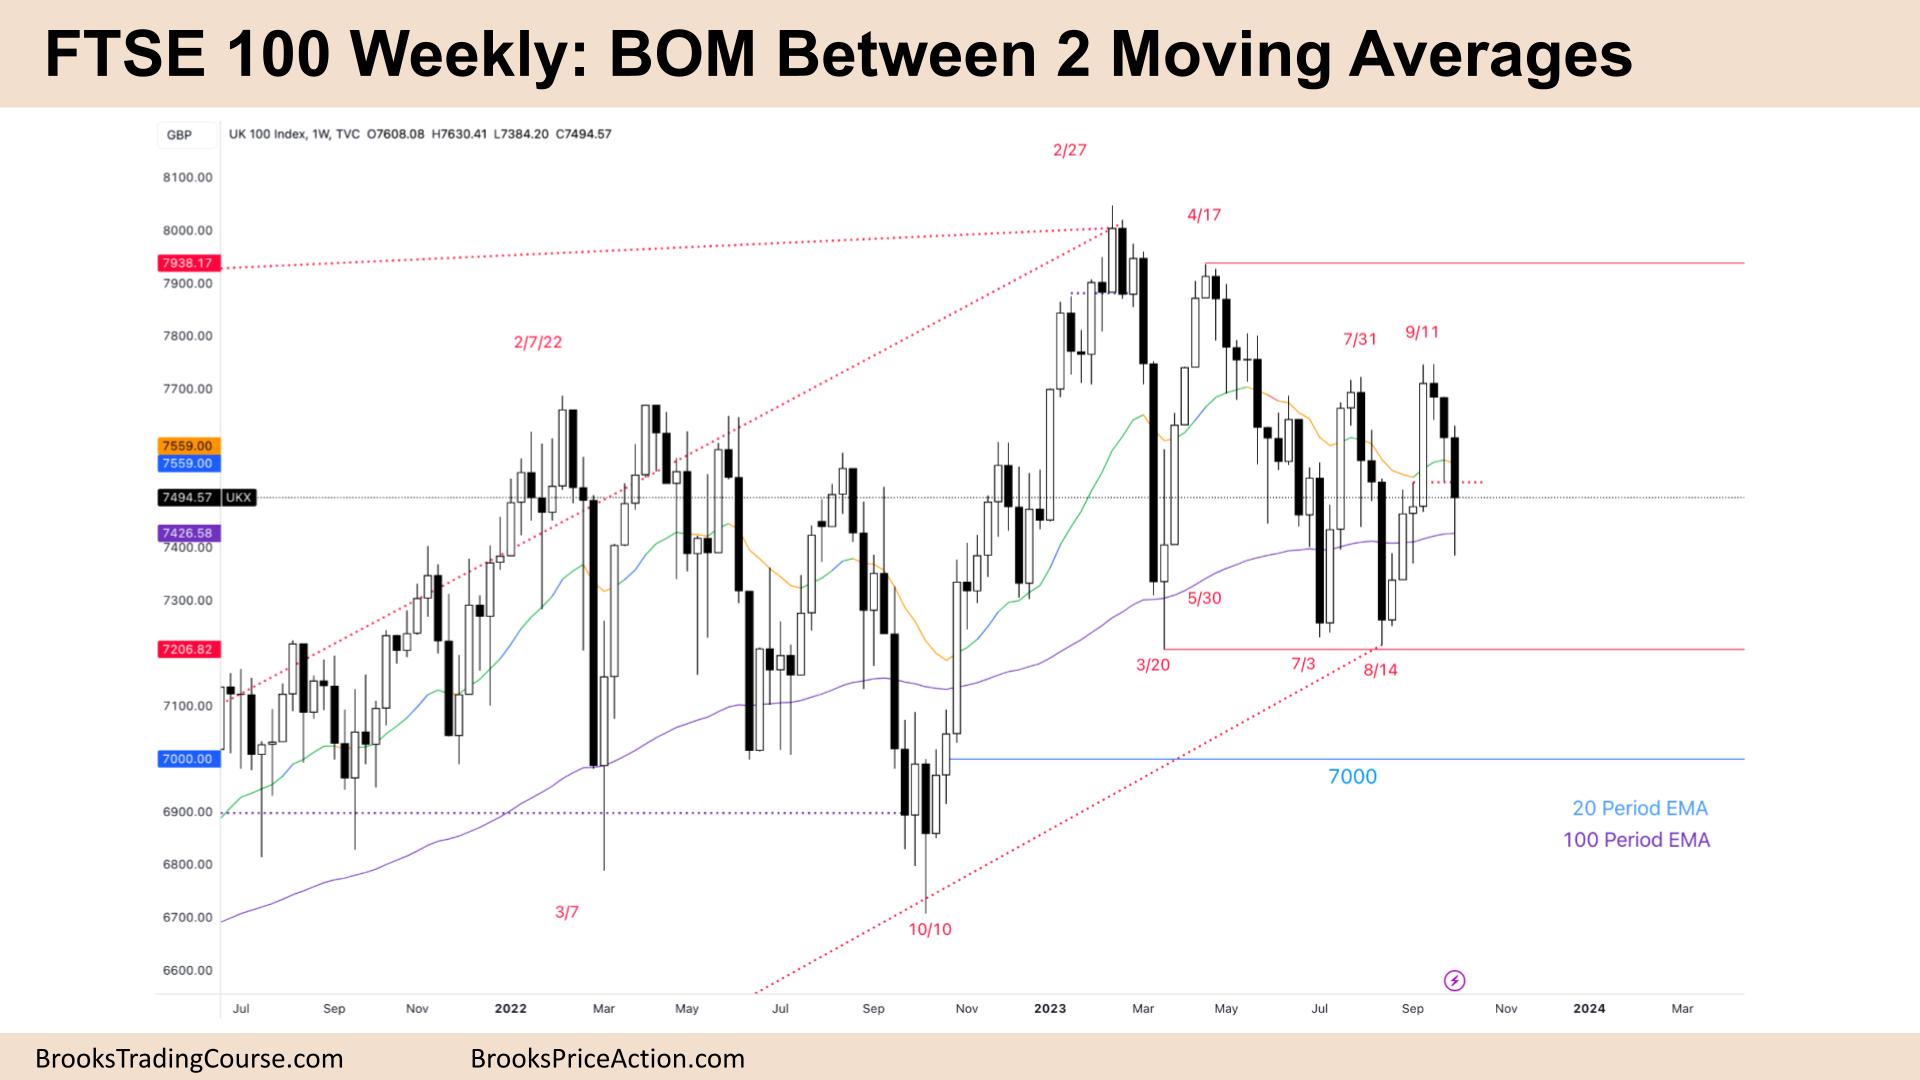
The FTSE futures market is in breakout mode (BOM) between 2 moving averages. The market is deciding where to go from here. There is a DB and a DT. It can be a wedge bull flag or a wedge bear flag. Take your pick! On this timeframe 50/50 so better to use a 2:1 target. Better trades will be one timeframe down on the daily for most traders.
FTSE 100 Futures
The Weekly FTSE chart

- The FTSE 100 futures on the weekly chart was a big bear bar closing near its midpoint with a big tail below – its breakout mode (BOM.)
- Both traders see the broad bull channel. Bulls see a wedge bull flag down to July, and we are testing the DB, another kind of wedge bottom or triple bottom.
- Bulls want to break out above the DT and get a MM higher to the ATH.
- The bears see a sell climax and a deep pullback to a LH DT.
- It is confusing because it is an expanding triangle – we went above the prior high and below the prior low.
- Expanding triangles move quickly in the middle and are surprising at the extremes, so traders should be careful.
- We triggered the sell below last week but were not able to close much below the low.
- This week has a big tail, so a bad stop entry sell trade below, and it is a bear bar, so a bad buy signal at the close.
- Expect limit order buyers to appear below the low as they made money last week doing that. They will likely try again.
- Big bars in trading ranges usually reverse – as traders are scalping, BLSHS and taking quick profits, the sudden market gift is a good time to exit. Next week should pull back.
- But trading ranges are disappointing, so better to be flat in BOM.
- We knew there would be buyers below the low of the big bull bar.
- It was a bull microchannel, and now we are a 50% pullback, so likely buyers here and below.
- But bears have a bear microchannel, and that puts sellers above the high and above the high of last week.
- It is BOM so the probability is 50%. But on the HTF the bulls have support at the 200-week MA.
- Until bears get a bar below that MA, it’s better to either be long or flat.
- Buy low and be patient. Expect sideways to up next week.
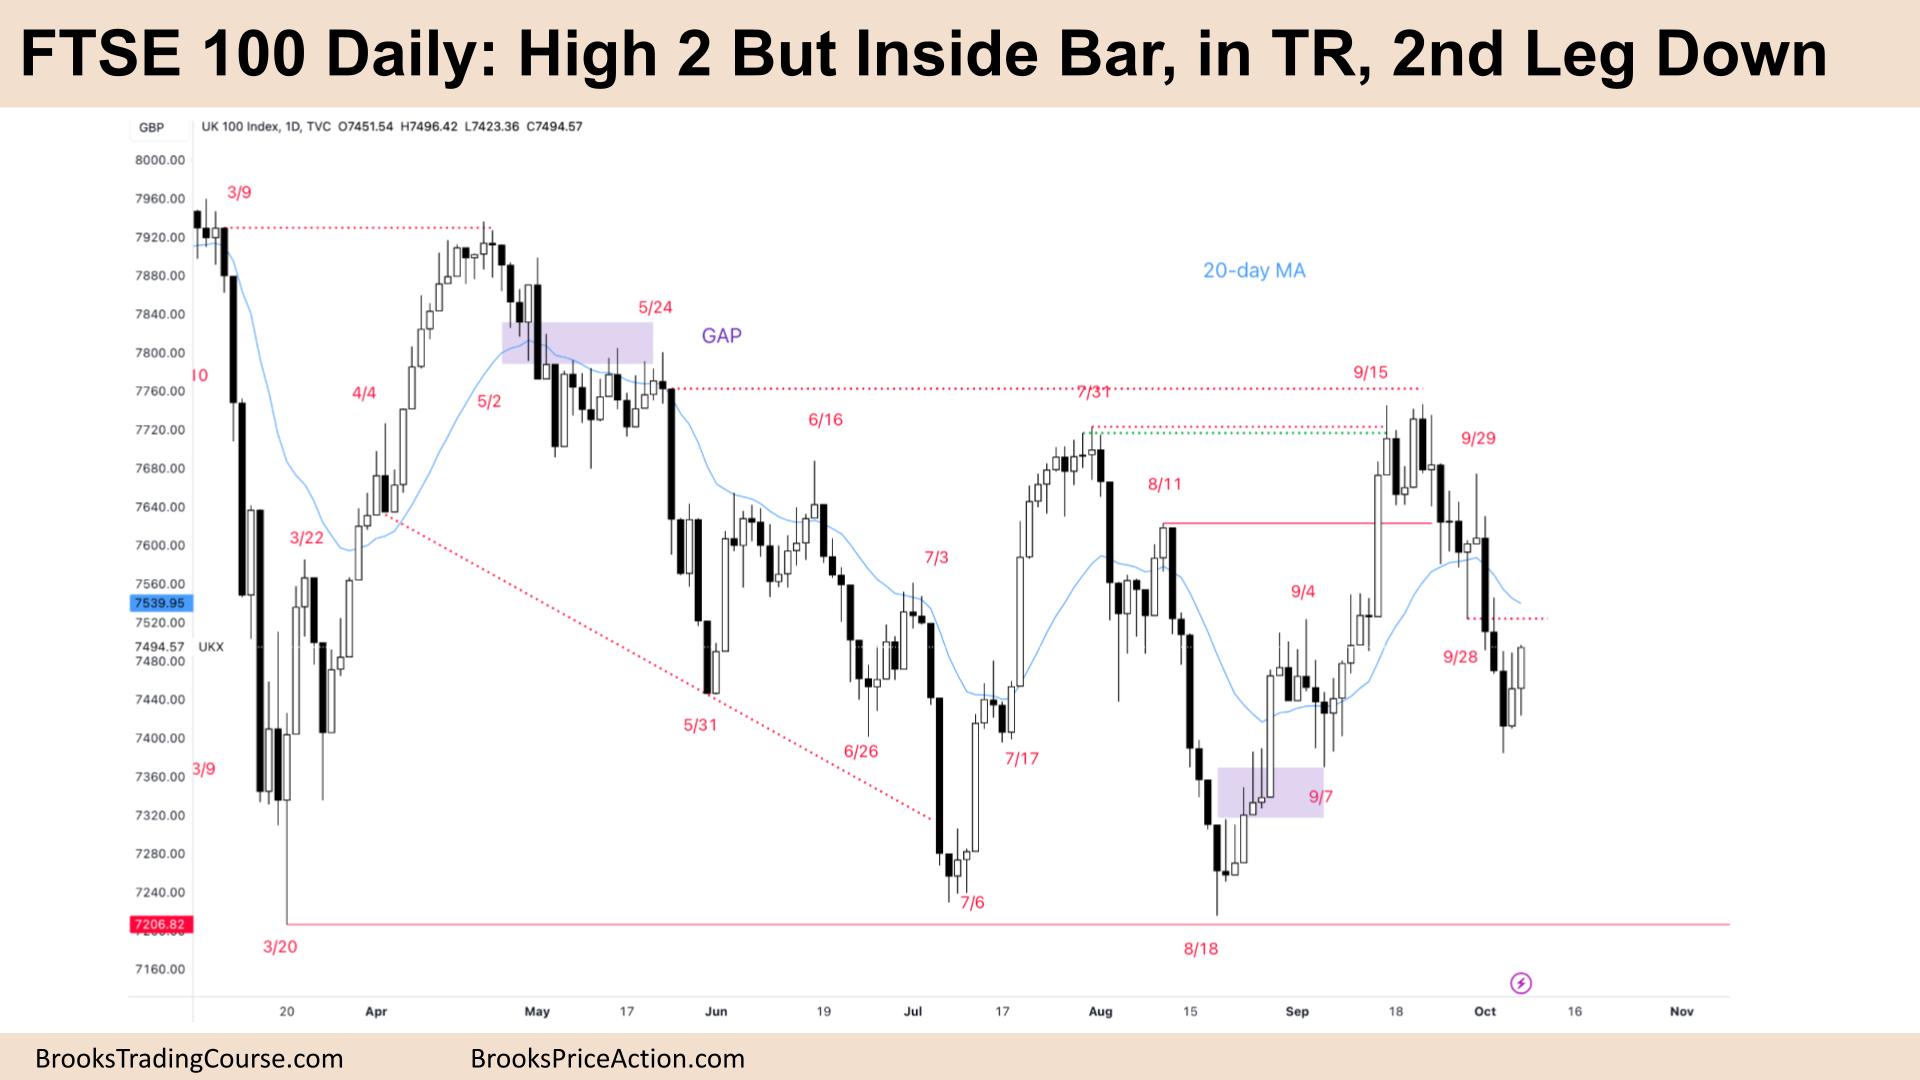
The Daily FTSE chart

- The FTSE 100 futures on Friday was a bull bar closing on its high and above the high of Thursday’s bull bar.
- It’s a buy signal, a High 1 in a bear spike, and we are at a TTR if you look to the left so a likely support level.
- The problem is the bear microchannel leading into it which is strong. That reduces the probability.
- Some traders will think that’s strong enough for one more leg down, so this first reversal is probably minor.
- Some bulls who buy here will take a smaller position and look to scale in below.
- My problem with the buy is it is an inside bar, which limits the upside. If you go long here you might get one bar before it reverses. So max profit target is the MA.
- But where do I put my stop? Inside bars are small, so the market tends to test both sides. I could use a swing stop 2 x the IB below, but my RR isn’t great.
- The swing point is unlikely to finally form here because it is a bear bar.
- A better trade, I think, is buying below that inside bar somewhere after the bears get a second leg. That second leg might be one bar.
- Because it has a good close, it’s a better sell above the bar – maybe one scalp size above the bar, the MA perhaps.
- If you look at the chart it is a trading range, and stop entries are rare. The trades that work out have weak signals and strong entry bars.
- So the past 2 weeks were a surprise as they had two stop-entry shorts that worked out.
- The bears might look at it differently. That we triggered an always-in-short trade, consecutive bear bars below the MA, good closes, and good size.
- The market often tests that entry point before continuing.
- So, always in short, with a good buy signal here, a possible High 2, but the probability is slightly better for selling.
- We are near 50% of the trading range, so a better buy will likely be found a little lower.
- Bulls want the two-legged pullback to the MA.
Market analysis reports archive
You can access all weekend reports on the Market Analysis page.