Market Overview: FTSE 100 Futures
The FTSE futures market moved higher on the monthly chart with BOM and a High 2 setup. We have been going sideways for many months at the top of the prior trading range. The moving averages are pointed up, so it is a tight channel that is starting to flatten out. The bulls want to trap the bears here. The bears want to break below the channel line and go sideways to down.
FTSE 100 Futures
The Monthly FTSE chart

- The FTSE 100 futures was a bull doji just above the MA – its Breakout Mode (BOM.)
- The bulls see a possible High 2 setup if we trade above this month. A High 2 at the MA is a high-probability trade.
- The bears see a possible head and shoulders top – a LH DT now and want to trade below the neckline for a possible MM down.
- We have been going sideways for two years, but only one bar is below the MA. That means we are in a bull channel, and trading below the MA is usually a buy zone.
- It was a bull microchannel up to February 2023, and traders have been buying below bars since then. But it was also disappointing the sell-off in March.
- The bears are yet to get to a good sell signal, and yet to get two consecutive bars.
- The monthly range is small, so we might trade above and below it next month.
- The bulls want the High 2 buy to work and get a FT bar up to the range’s high.
- The bears want it to fail and create a possible Failed High 2. But a failed High 2 sets up a High 3, which is an even higher probability trade – hence the lack of sellers here at the MA.
- The bears must trigger another sell signal below a bear bar to get strong selling. Otherwise, bears will wait until the highs of the range again.
- Bulls were a bit disappointed the bear bar was so big – some traders might have gotten out back at their entry two months ago at breakeven – some bought more at the MA and made money.
- Expect sideways to up next month.
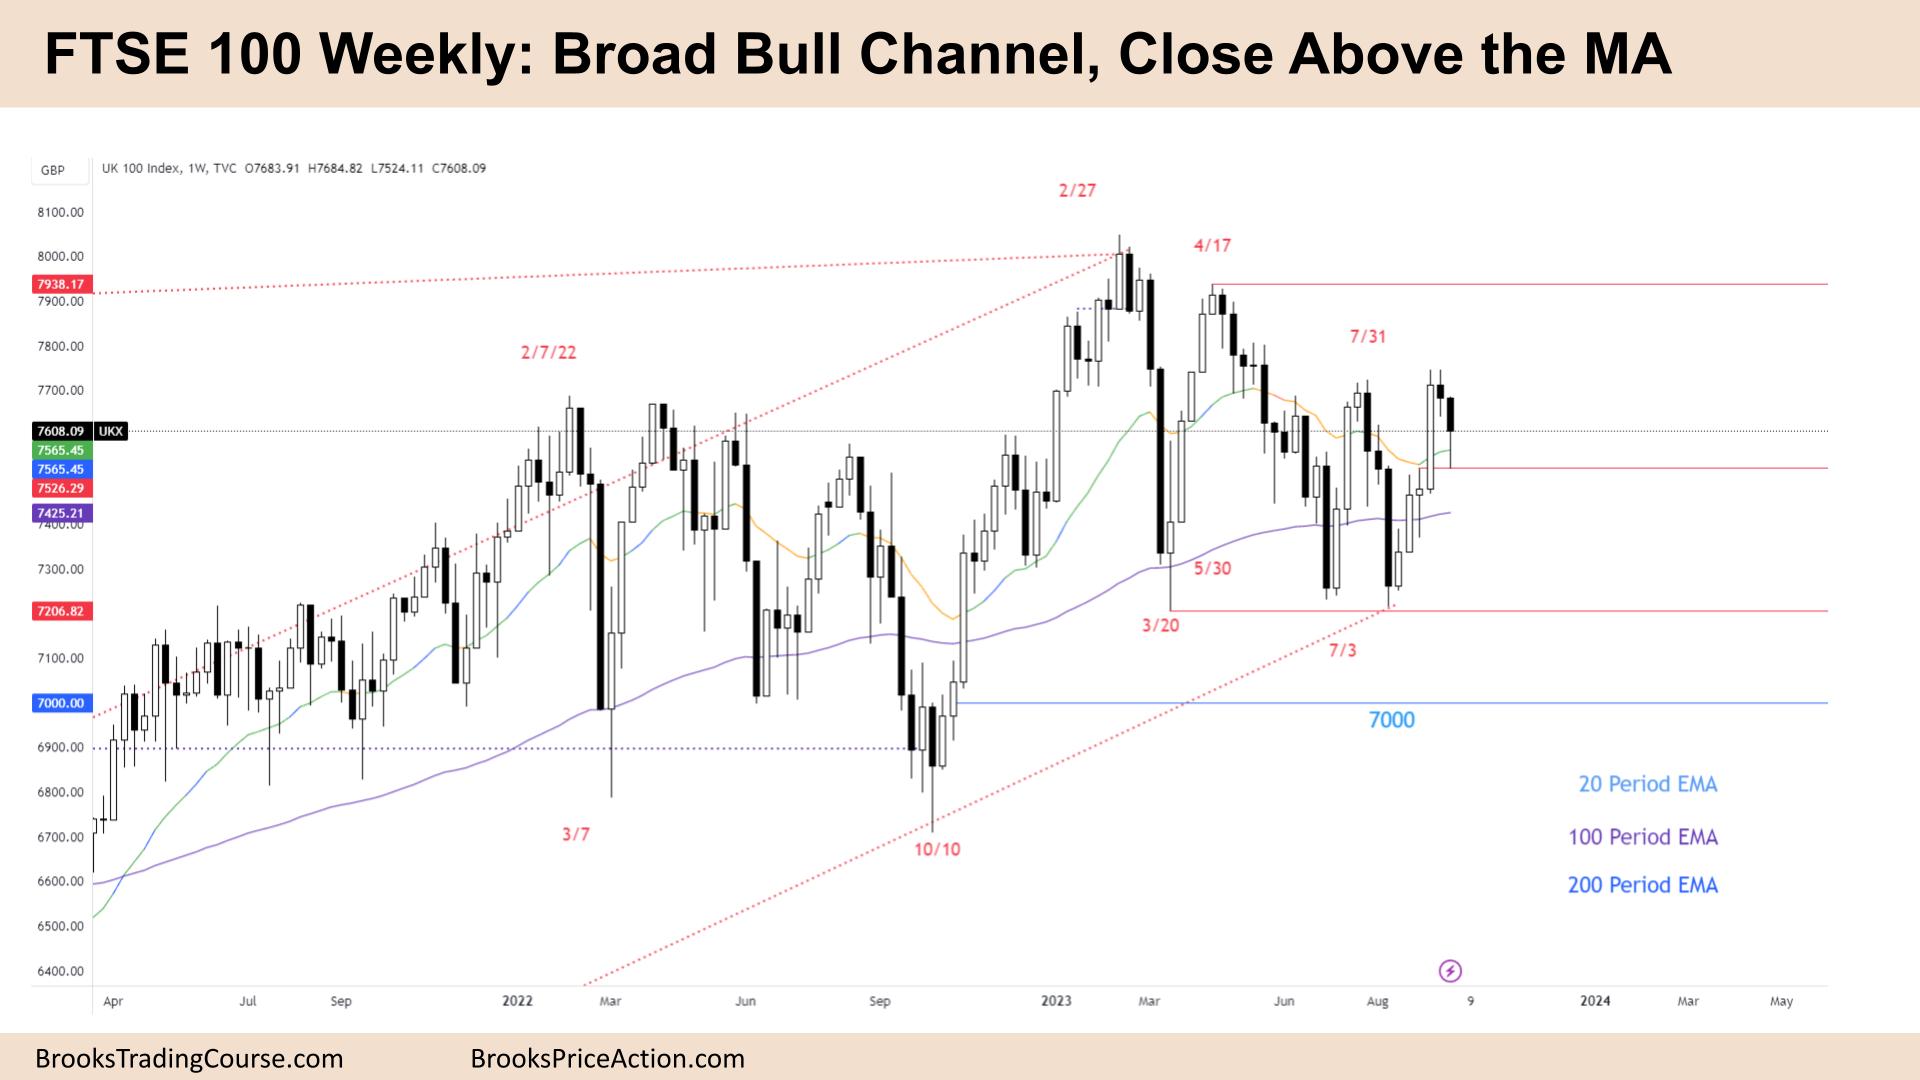
The Weekly FTSE chart

- The FTSE 100 futures was a bear bar closing above its midpoint and a big tail below but closing above the MA.
- Its a pullback and a pause bar after the strong bull climax bar two weeks ago. We said there would be buyers at the midpoint.
- It is BOM on a higher time frame, so the moves have less than three legs.
- The bulls see a DB at a HTF trendline and a bull microchannel. Every low above the low of the prior bar. There will be buyers under the big bull bar.
- Traders expect a second leg after such a strong push, so this reversal is more likely to be minor and bulls to get one more bar up.
- Bears see the last strong leg as bearish – the parabolic wedge and expected two legs sideways to up to correct it. The bears want to resume now. They got their bear close below a bear bar.
- But the bulls got strong closes above the MA, which is likely a trading range.
- It is a bear doji with a big tail below, so a weak sell. But it is also not a great buy yet.
- Bulls want to get above it and run the stops on the bears here. Then they can try to get a measured move of that bar up to the April highs.
- Trading ranges are full of disappointment, so expect sellers above and buyers below.
- There is still a gap open below – the bears will want to move lower to keep it closed.
- The move started from a bear bar as the low pivot, making it less likely to go straight up from here.
- Four bull bars in a row, so we expected to test the high of the third bar – bears were fading there and got stuck. Now it has been tested so that it can go higher.
- Expect sideways to up next week.
Market analysis reports archive
You can access all weekend reports on the Market Analysis page.