Market Overview: FTSE 100 Futures
The FTSE futures market has had shrinking volatility into breakout mode into a triangle near the MAs. While we will probably get a move up and a move down, until the bears break strongly below that bull trend line, the scale in bulls will continue to strongly buy lows and scalp. The market is still at the prior BO point and the previous TR high, so traders are deciding on the new range.
FTSE 100 Futures
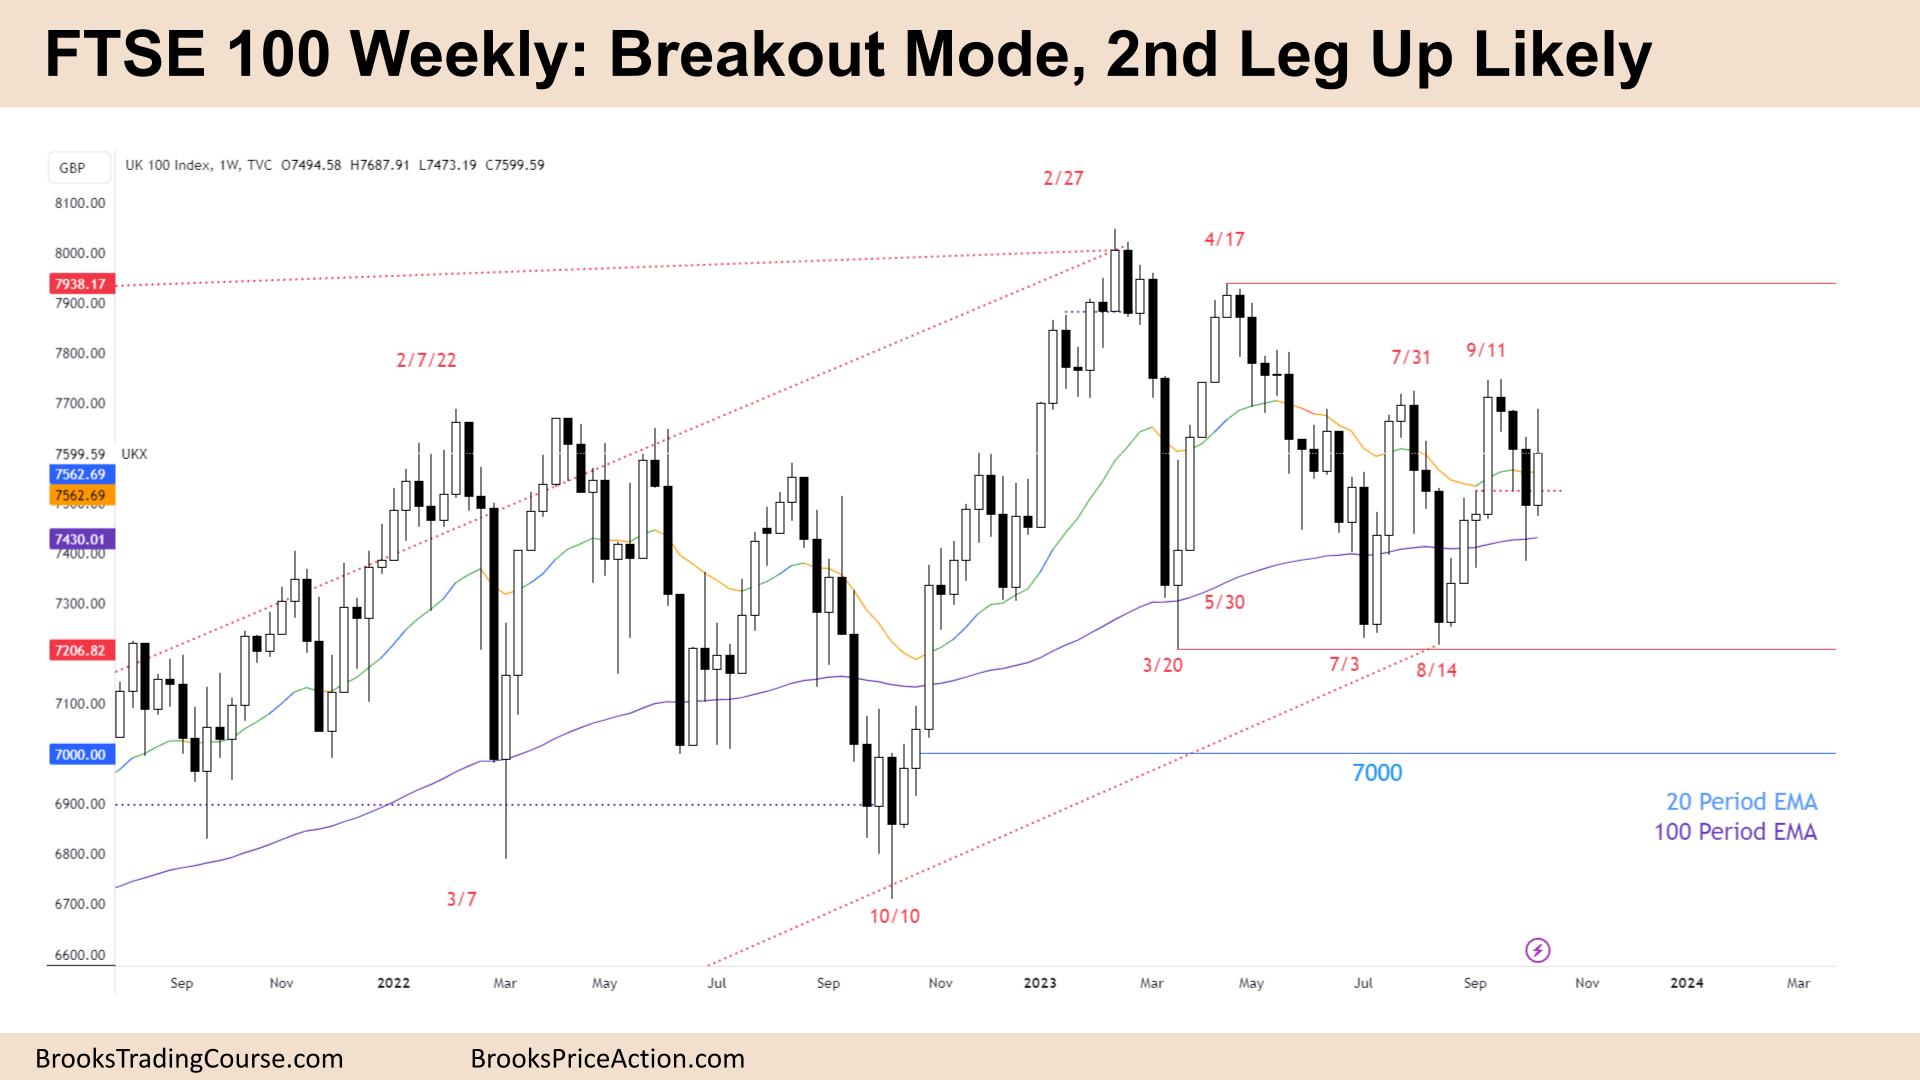
The Weekly FTSE chart

- The FTSE 100 futures last week was a bull bar closing above its midpoint with a large tail above.
- It is a better buy than sell, but at the MA in the middle of a triangle, the odds are 50/50 so you can take it as a swing.
- The market is in a broad bull channel and moved up from the trend line with a wedge bottom or a DB with a test and a High 2 / High 3 buy signal that triggered.
- The bulls got a strong bull microchannel with gaps, so it was reasonable to buy below the big bull trend bar, expecting a second leg up.
- The bears who were short had to scale in above the sell climax, and they made money.
- When both traders are making money, then it is not likely trending anymore.
- Because we are at the MA, traders are less willing to buy the close or sell the close and will likely wait for consecutive bars in any direction.
- The 3 bear bars are disappointing for the bulls; they had a chance to scalp out of their longs. Bulls who bought under the bear doji got our breakeven on their first entry and a profit on the second.
- More likely, the bears got stopped out at the start of September. That was the lower high and swing high. If you sold the small bear doji in September, you had 2:1, so you probably took it.
- So, only bulls are on the swing now from August.
- Most traders will wait for a BO and FT above this DT for a measured-move up and a test of 7900.
- Expect sideways to up next week as we stay in breakout mode.
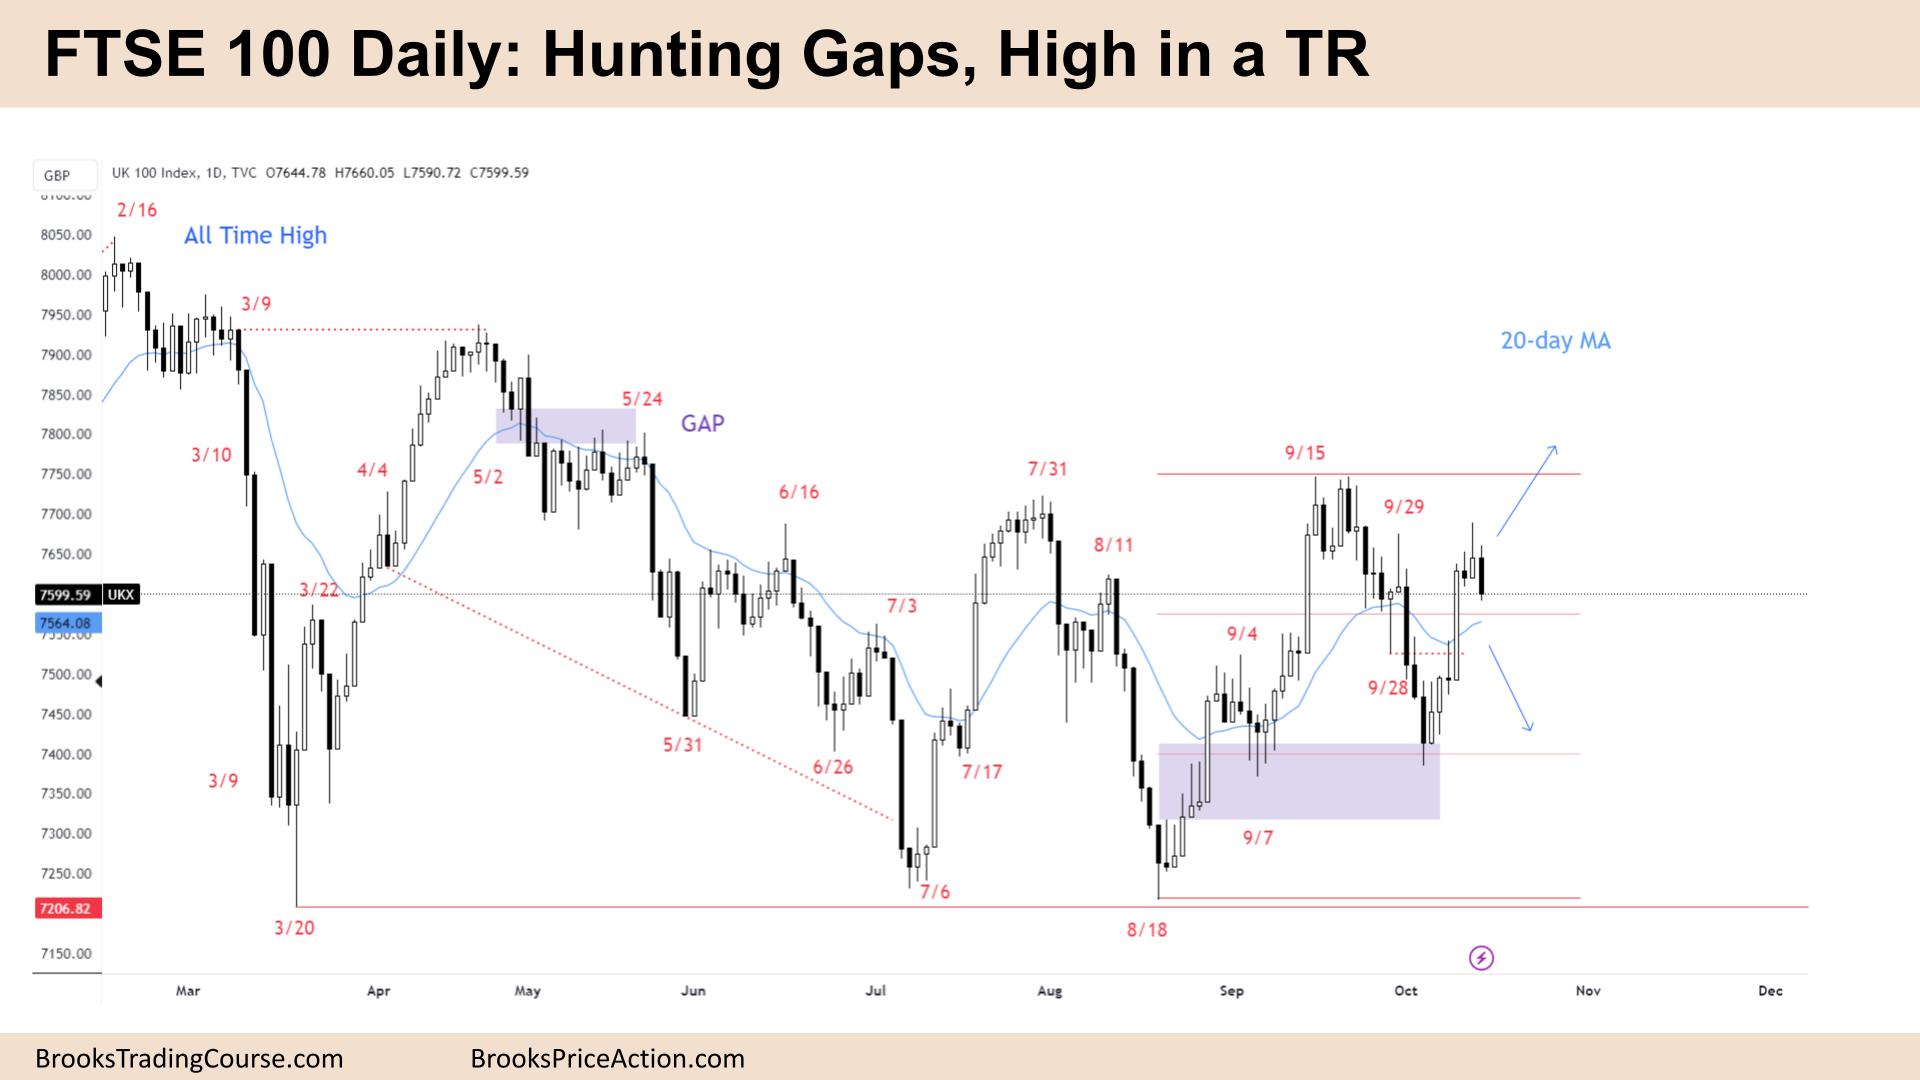
The Daily FTSE chart

- The FTSE 100 futures on Friday was a big bear bar closing near its low. We might gap down on Monday.
- There are still two gaps in this TR that need to be filled.
- It is a Low 1 short high in a trading range, so buying a scalp size below is probably better.
- Traders usually get 2 attempts to reverse a move. And the bull spike up was strong.
- The daily chart shows a wedge bottom to a DB, a LL MTR. The HL in September can be the start of the bull trend.
- But the bull trend bar had bad followthrough – a bear doji. That could indicate TR still, and so traders will not buy high, instead looking to fade selloffs and sell rallies.
- A Big Up move following a Big Down move creates Big Confusion. When traders are confused, they are confident of only one thing. They doubt either side is strong enough to start a trend. Therefore, they expect every strong move up and down to reverse instead of leading to a trend.
- Also, they buy selloffs and many scale in lower. Finally, they take quick profits because they do not believe a trend is underway.
- The result is a trading range when traders buy low, sell high, and take quick profits.
- Some bears sold the MA and got trapped, so I think a better buy is near the MA with them looking for a test of that trend bar.
- The bulls want to trap the bears here and trade below Friday, triggering a stop entry sell and then reverse outside up and get FT.
- Most traders should look for a good buy signal low and a good sell signal high.
- Remember, it is breakout mode, so scalping is a better strategy than staying flat.
Market analysis reports archive
You can access all weekend reports on the Market Analysis page.