Market Overview: FTSE 100 Futures
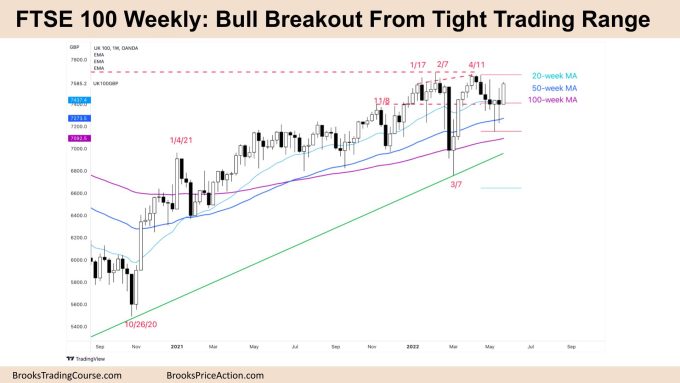
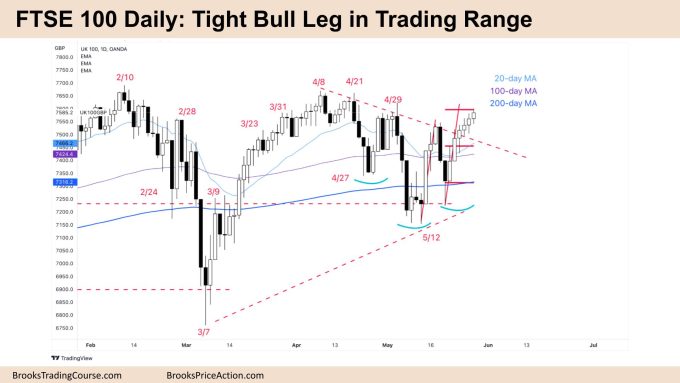
The FTSE futures market raced higher with a FTSE 100 bull breakout, 6 bull bars on daily chart, so we are always in long on the daily timeframe. The tight trading range was in the middle of a larger trading range so traders should expect scalping to continue and take quick profits. The bulls want follow through from this week to test the highs for a measured move above. The bears want a Low 1 sell at the top of the range.
FTSE 100 Futures
The Weekly FTSE chart

- The FTSE 100 futures was a bull breakout from a tight trading range closing on its high so we might gap up next week.
- It was breakout mode for the past few weeks so there was a 50% chance either way. Although it is bullish, tight trading ranges often have failed breakouts, so we might end up back here next week.
- For the bulls, it was a High 2 buy, trend resumption after a 5-week tight bull channel to the highs of the range. The bulls need a follow-through bar closing above its midpoint to convince traders we can break out of the wedge to the left.
- The High 2 wasn’t a great buy signal bar, a bear doji. That is the problem with trading ranges, the entries are rarely what you are looking for and so traders will often exit quickly with a scalp.
- For the bears, it is a pullback from a wedge reversal and a possible lower high major trend reversal. But it’s a strong bull bar so the bears might be hesitant to sell until we pause next week.
- It could be a bull trap, high in the range so we could also expect bears to scale in short above the bar next week.
- The math is better for the bears in the top third of a trading range so we can expect bulls to exit and bears to scale in. A possible magnet would be the prior high of the wedge which is also a measured move target for the bulls.
- The bears want this to fail and set up a double top, up in the highs of the trading range for a higher probability short entry. The bulls would then look for a High 3 or wedge for one final attempt at breaking through the prior highs.
- Look left – we have been at this range since January this year so we should expect sideways to up trading next week as traders will continue to bet on failed breakouts.
- Best to be either long or flat. If you’re long, take partial profits at the prior highs. Look to add on if we get consecutive bull bars closing on their highs next week.
- If you’re looking to get short, there is no entry yet as it’s a bull breakout. Very experienced traders could scale in above the prior highs next week, expecting bulls to exit.
The Daily FTSE chart

- The FTSE 100 futures ended Friday with 6 consecutive bull bars so we will likely trade higher next week.
- For the bulls it is a tight bull channel, a bull breakout and bears will be hesitant to sell 6 bull bars in a row. Traders expect the first reversal to be minor.
- They see the 2 legs down from a major trend reversal as finishing on May 12th and expected a trend resumption back to the highs, that remains true.
- For the bears we have been always in short for nearly 6 weeks so it is likely we are still in a trading range. They see a 2 legged pullback from a major trend reversal.
- If you look left you can see we have been at this price point for many weeks and it is likely this is either middle or the top of a trading range, so the maths favours the bears.
- The bears see a possible 2nd leg bull trap at the top of a trading range and although the first reversal is likely to be minor, bears will scale in above bars.
- We are currently at a measured move target from the High 1 so we expect traders to exit. If the pullback is deep, traders might see the double top with April 29th and short strongly.
- No matter how bullish it seems, trading ranges look most bullish at the top and most bearish at the bottom, this is confusing to traders and most traders should wait for second entries.
- Best to be either long or flat right now. If you’re long, take partial profits at the measured move targets and the highs. Exit below a bear bar closing below its midpoint.
- There is nothing to short yet until we get a daily chart bear bar.
Market analysis reports archive
You can access all weekend reports on the Market Analysis page.

