Market Overview: FTSE 100 Futures
The FTSE futures market moved higher last week with a bull follow-through bar. It is a surprise and should have a second leg – though pullbacks have been deep, and it is the middle of a trading range. Traders should be looking to BLSHS. After such a tight bear channel, the first reversal should be minor.
FTSE 100 Futures
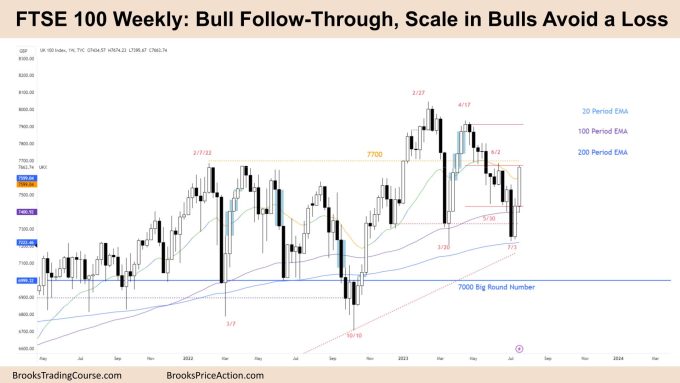
The Weekly FTSE chart – Bull follow-through

- The FTSE 100 futures last week was a strong bull follow-through bar closing on its high.
- We said last week that buyers have enjoyed the 200-week MA and they did again! Their trade right away went 1:1.
- The bulls see a breakout above a trading range and a deep pullback having two complex legs.
- The first pullback was disappointing, and so bulls got out. The next leg was stronger, and bulls bought the trend resumption only to get caught again at the top. They got a chance to exit this week.
- Any bulls caught high can scale in lower and buy the close of a strong bull reversal bar (especially after 2 or 3 legs), and it got to their midpoint.
- Bears see a trading range and shorted high and were right. They expected a strong second leg and got a complex one with at least three pushes.
- The sell climax bar last week was a profit-taking bar. It was reasonable for the bulls to buy the reversal up.
- The question is now, how far will it go? 1:1, 2:1?
- Any bulls caught in June are now out – a failed High 2.
- Many failed signals and surprises – so it is a trading range, and traders should BLSHS and take quick profits.
- We have been saying that this prior ATH would be a magnet, and we are back there now.
- Scale in bears who sold low and above the high of the sell-climax – reasonable, probably need to exit before we go up.
- If next week starts strong, they might exit with a loss.
- If you’re a bull, your stop is far away, and your 1:1 is above the high of the range so we might go sideways here or get a small bull bar.
- Expect sideways to up next week as bulls decide whether to keep swinging higher.
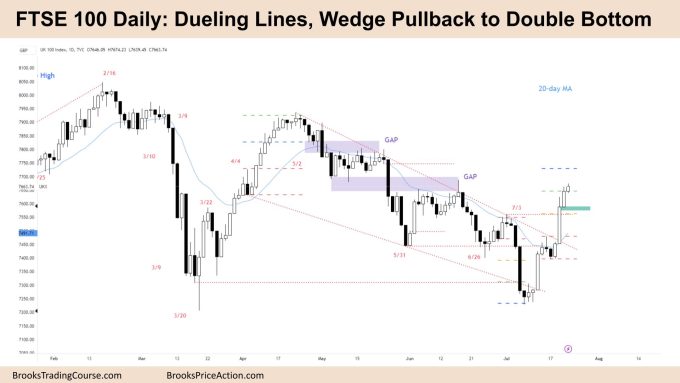
The Daily FTSE chart – Bull follow-through spike after dueling lines

- The FTSE 100 futures on Friday was a small bull bar with a tail on top.
- It is the fourth consecutive bull bar with at least two gaps, so it is a strong bull microchannel.
- There are likely buyers below the low of the prior two strong bull bars – especially the larger one I marked.
- The bulls see a completed dueling lines pattern – a wedge pullback to a double bottom/top. Here is a double bottom.
- “When a pullback is contained by a trend channel line and it ends at a higher time frame support or resistance line, this is a dueling lines pattern, and it often results in a reliable trade in the direction of the larger trend.” Dr Al Brooks.
- The bears got trapped on Monday. A small bear follow-through bar.
- Although it didn’t trigger the stop entry below, those trades typically move 2x the size of those reversals – because it was a low-probability trade, and the bulls that took it needed 2:1.
- Bears see a break of a swing high and now a trading range. They want to see where bulls will put in a higher-low. Bears will sell near open gaps – a magnet in trading ranges.
- Bears want this to be a parabolic wedge top – but so far, no reversal bars to sell – so better to be long or flat.
- If we are in a trading range, there should only be two legs. So the appearance of a third leg is good for bulls.
- Expect a brief dip below the low of a prior bar, but expect sideways to up.
Market analysis reports archive
You can access all weekend reports on the Market Analysis page.