Market Overview: FTSE 100 Futures
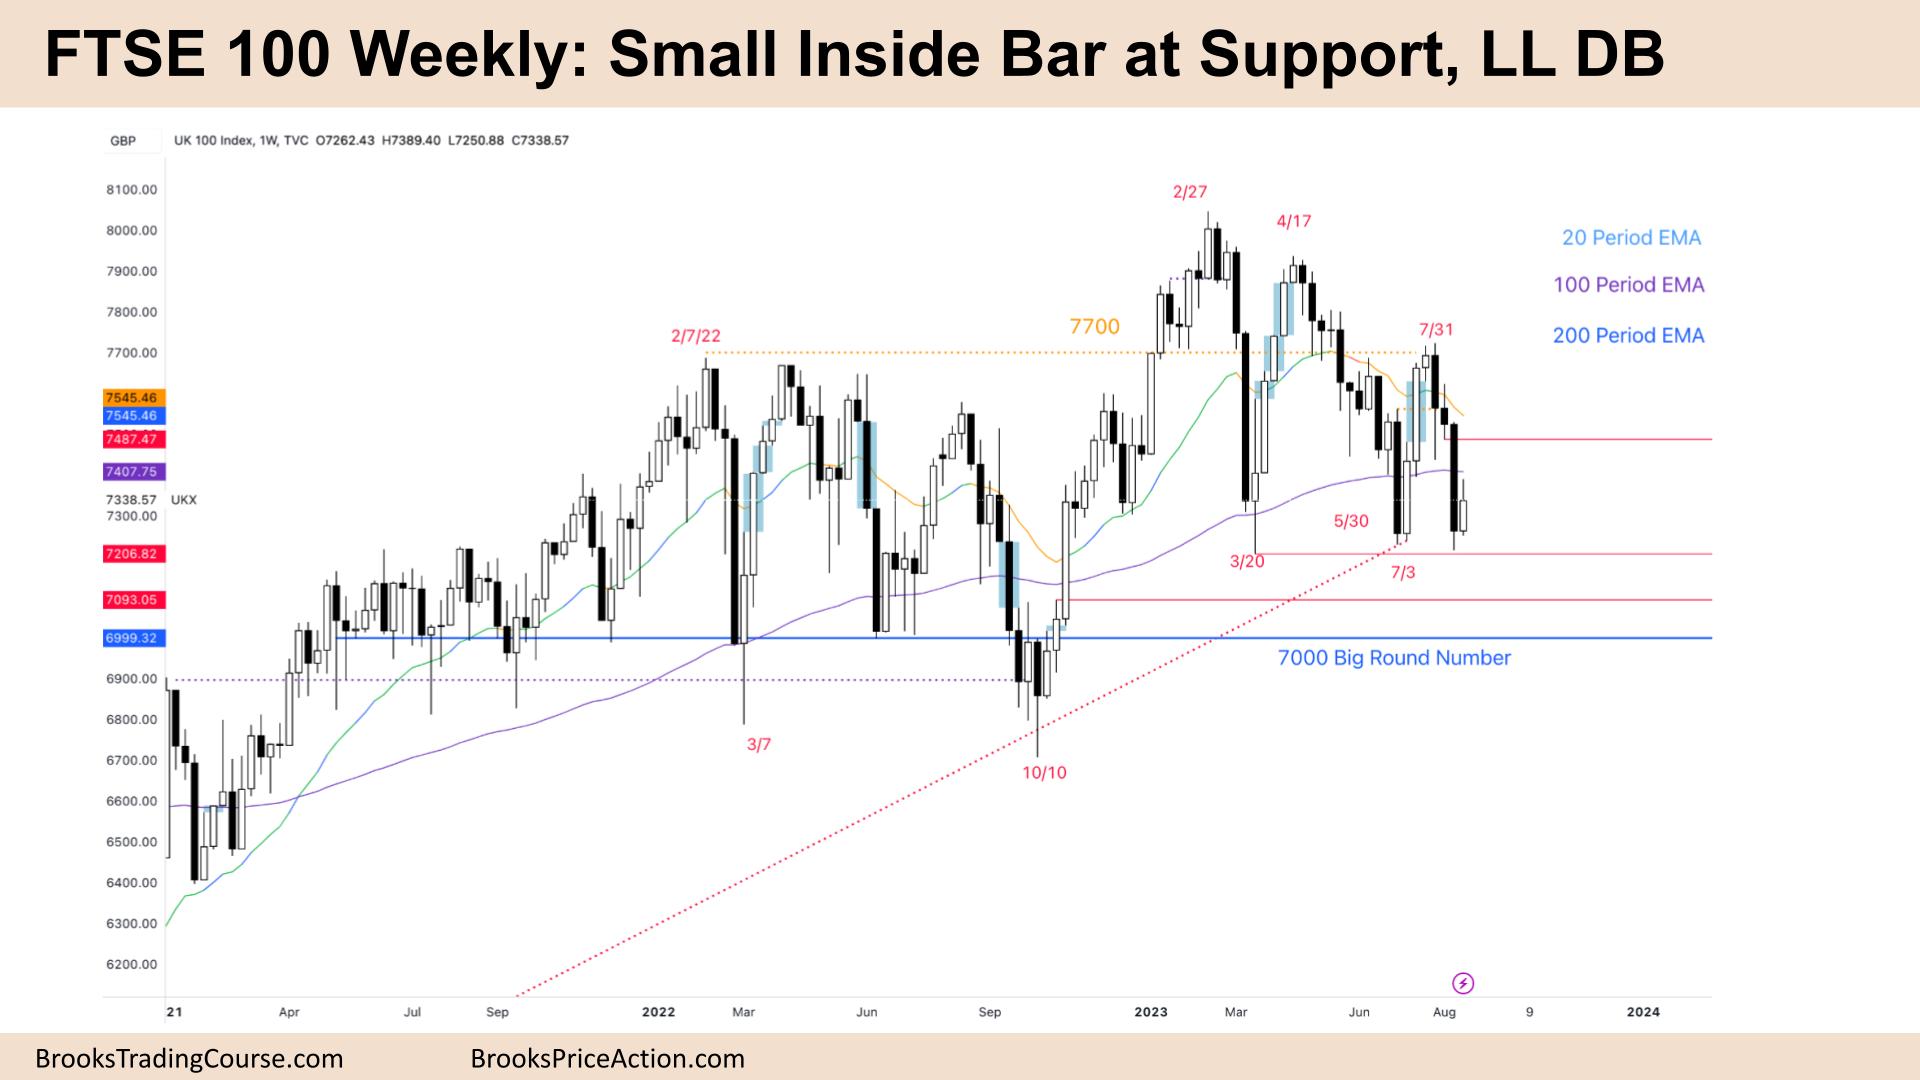
The FTSE futures market moved higher last week with a small inside bar, a bull bar. It is a pullback, and traders will expect a test of the low close or even to see what is below the big bear bar earlier. We are at support, a trend line and low in a TR, but where was the big bull reversal? It is a Low 1, but a bull bar is not a great sell signal. Lets see what happens.
FTSE 100 Futures
The Weekly FTSE chart

- The FTSE 100 futures chart last week was a small inside bar, a bull bar.
- It follows a big bear climax bar closing at a trendline and support.
- It was a LL last week, so it was a BO. But there was no follow-through.
- BOs of inside bars have a higher failure rate. This places traders at an interesting point. The sell below the inside bar is a scalp only.
- And most traders will sell below the prior low for a swing. But a swing low in a TR is not a high-probability trade.
- You can buy above the inside bar, which is also a scalp. With scalps in both directions, it is likely a TR, and we will go sideways for a few weeks here after maybe one more bear bar.
- Traders are deciding if we need to test 7000 one more time.
- The bulls got a new ATH, a BO, but the FT was weak. And the pullback was deep as well.
- Some bulls will see a wedge bull flag. If we trade above the high of this bar, some traders will see a wedge and expect 2 legs sideways to up. Probably testing the top of the July sell climax.
- Most bulls should wait for a better signal bar. If there are 2 or 3 consecutive bull bars, then it is a credible swing.
- Bears see a failed BO above a TR, and with so many consecutive bear bars, it is unlikely we are still in a bull trend. They were selling and selling higher.
- We are still always in short, so better to be short or flat.
- If you are short, you can exit above the IB or look to sell more at 50% of the climax bar, expecting a small second leg sideways to down.
- There is nothing to buy yet. Bulls should wait for a second entry long and a strong signal bar for a stop entry.
- Expect sideways to down next week.
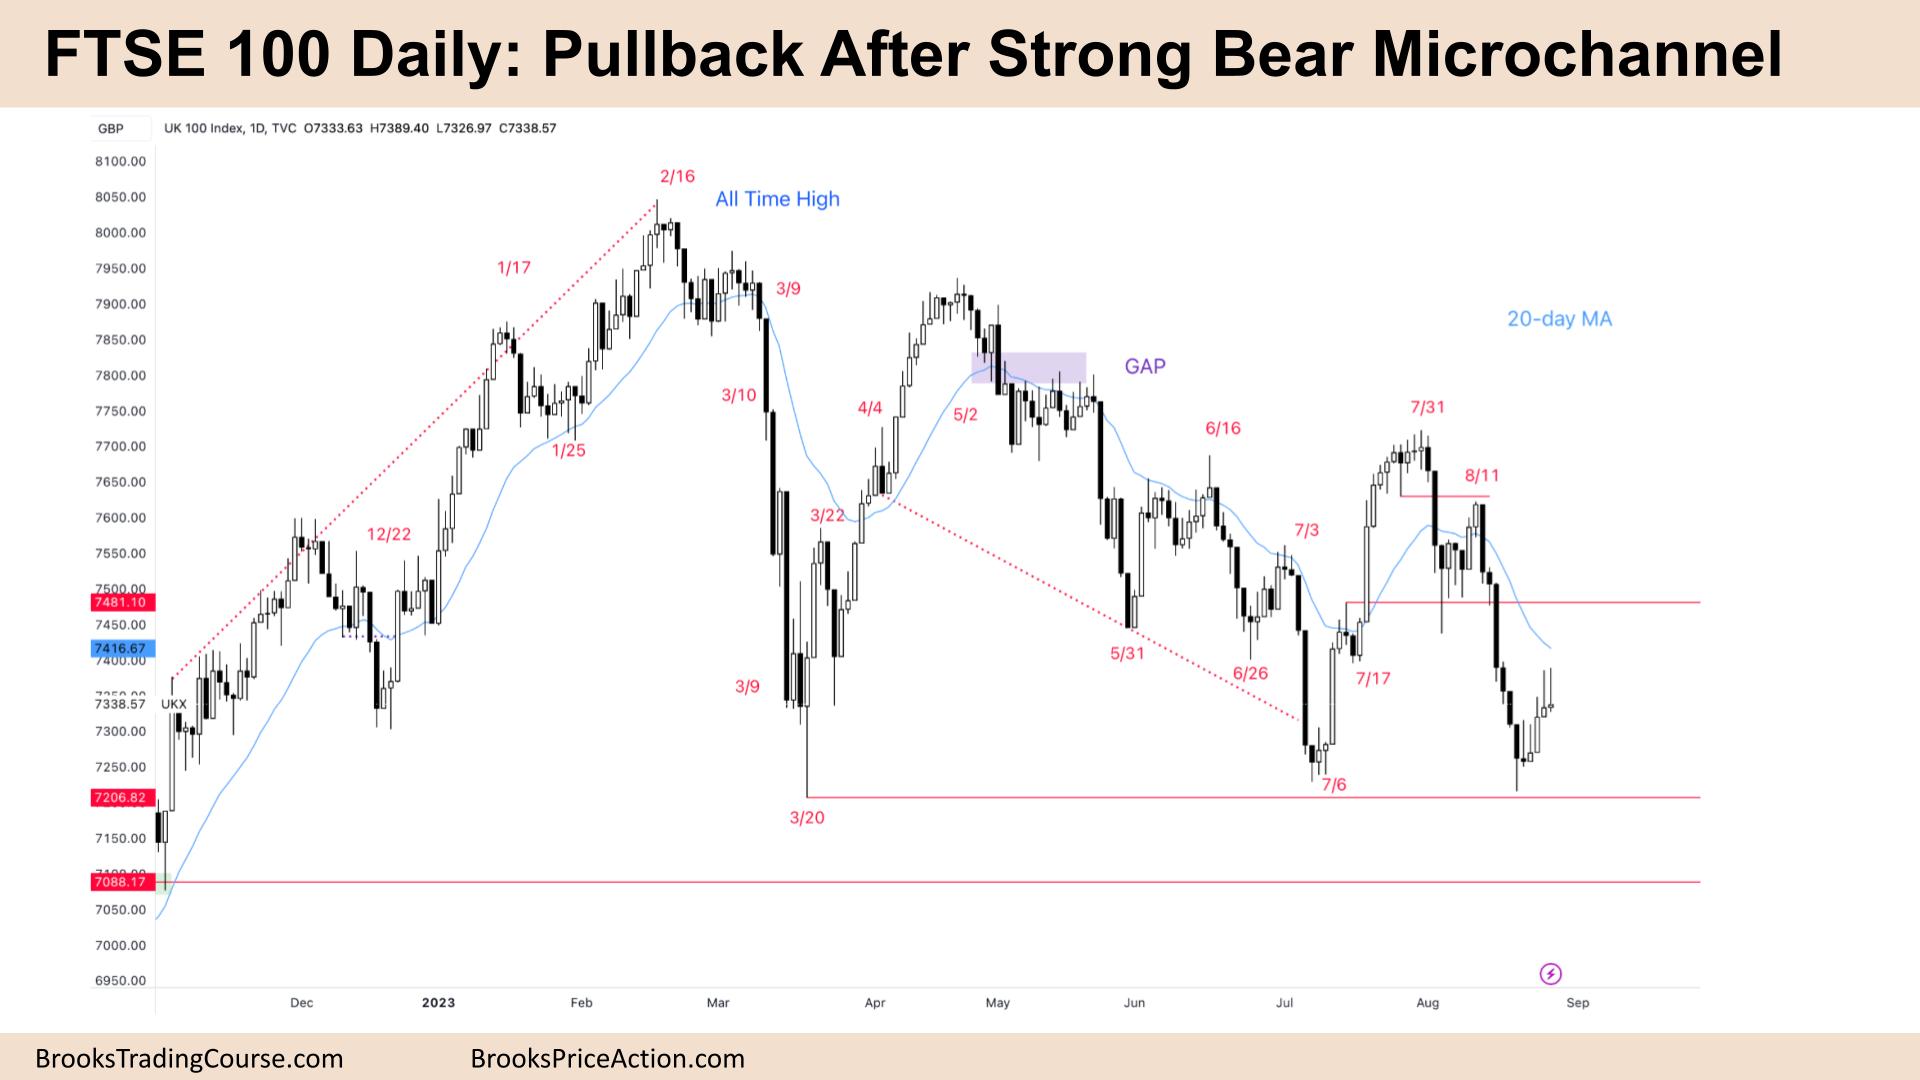
The Daily FTSE chart

- The FTSE 100 futures chart was a small bull doji on Friday after a sideways to up week.
- It looks more like a pullback from a strong bear microchannel, and most traders expect a little more sideways to down.
- It was a small inside bar on the weekly, so this makes sense – a lack of trending behaviour.
- There were sellers above the highs of the prior strong bear bars, which is normal PA behaviour after a strong spike.
- The bulls never got a strong follow-through bar, which tells you the likely situations for next week.
- Bears should get another strong bar next week and test the low close. Or a small pullback and another bull leg sideways to up.
- The low probability on this chart would be a strong give-up bar from the bears and a big bull bar.
- The bears have two reasonable sell zones above – the MA and the BO point. We have a bear BO gap right now, which will likely attract sellers.
- Can you be long here expecting a swing-up? The maximum probability is 40%, so it can be for a scalp. If you take that trade ten times, you will lose most of the time.
- The bulls do have trending lows now so it makes it more likely to have buyers below. If you do buy below, you need to plan how to manage a strong BO below.
- Expect sideways to down next week after a small inside bar – we will probably need to test above and below it.
Market analysis reports archive
You can access all weekend reports on the Market Analysis page.