Market Overview: FTSE 100 Futures
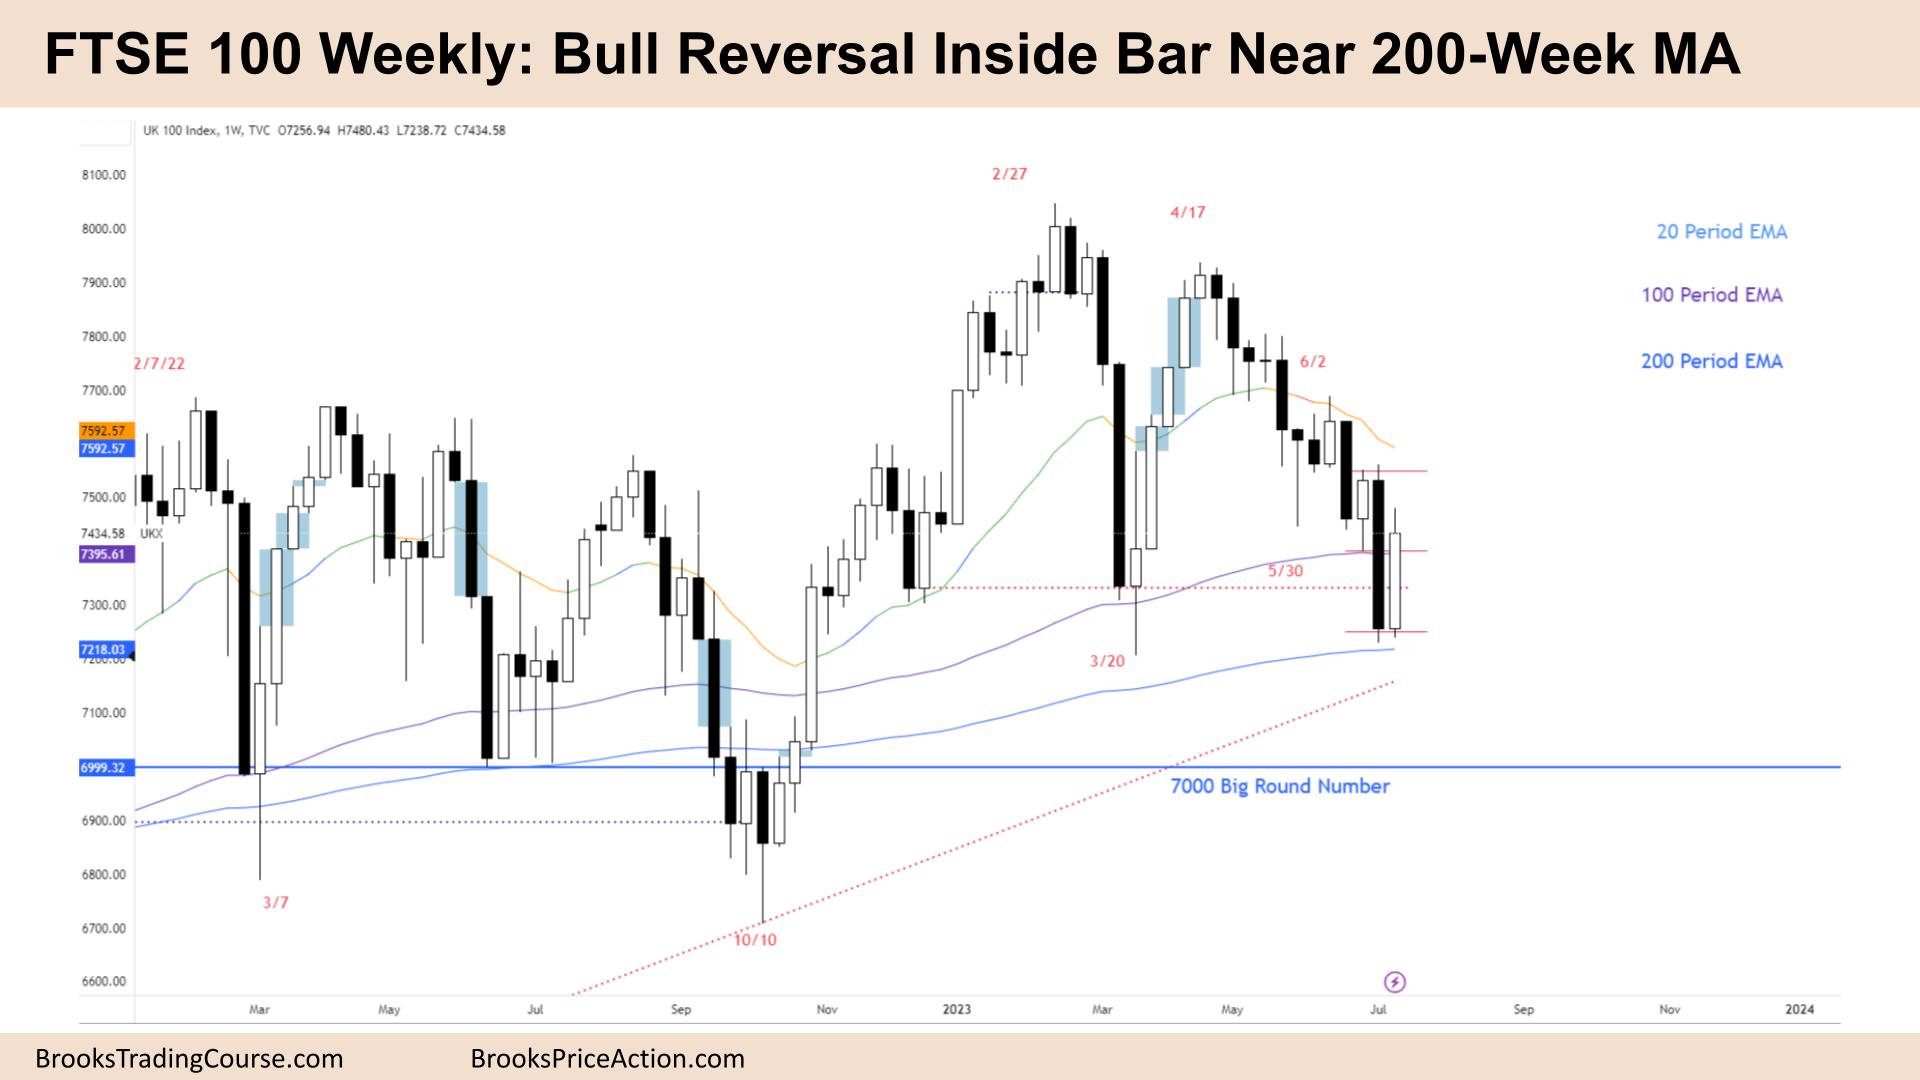
The FTSE futures market moved higher last week with a bull reversal, an inside bar on the weekly. The daily chart looks like a V reversal as the bears who had gotten trapped had a chance to exit. Bulls were looking for a chance to buy the lows of the trading range, and a late bear climax was good enough. Bears want this to be a break below a wedge bottom but at the 200-week MA is more likely support at this stage.
FTSE 100 Futures
The Weekly FTSE chart

- The FTSE 100 futures last week was a big bull inside bar, closing near its high with a small tail above. A possible bull reversal pattern.
- It did not trigger the sell below last week’s strong sell climax bar, and it reversed immediately. It is a type of bull reversal.
- The bulls see a deep pullback from a 5-bar bull microchannel, and we have not gone below its low. They are expecting the second leg. However, this is now disappointing for the bulls.
- Inside bars are triangles and lack a BO above or below – so it is a pause.
- Disappointment means a trading range, so we are unlikely to break out below or above – as bulls will buy lower and scale in to break even on their entries.
- The bulls have not had a chance to get out without a loss and took reasonable buys, so we should let them out before we go down much further.
- The bears see a 4th leg down from a LH DT, and a MTR. They see a failed break above a trading range and now want a break below the neckline for a measured move down to 6500 – 30% chance.
- The problem is the several-year monthly trendline below and the 200-week MA.
- The bulls see a duelling lines pattern, a wedge bull flag back to the lows – a common DB pattern.
- The bears want it to be a break below a wedge and a MM down but it is confusing. There should have been buyers at the MA in June, but it failed. So probably trapped bulls there.
- Some bears sold the March climax bar and got stuck – they just got let out.
- Bulls who bought the High 2, two weeks ago had to buy more at the lows or a MM of that bar down. They made money.
- So limit bulls are making money which means the bear move is not as strong as it could be.
- Traders should expect sideways to up next week.
The Daily FTSE chart

- The FTSE 100 futures was a small bear doji on Friday with a big tail above.
- Most of the bar is above the MA, and it broke above Thursday. There should be buyers below.
- It is not quite a V reversal yet, but the setup is getting more likely. A V reversal is usually the 2nd leg of a DB or DT.
- The bears got a breakout and follow-through, and it immediately went to a swing target MM.
- The bulls see a wedge overshoot and a strong reversal. The bulls who bought the implied High 2 got 3:1 immediately. And there was follow-through buying – that is strong.
- It looks like bears were stuck from March who were selling the lows and got a chance to get out.
- The bears see a bear channel, and there is some strong resistance above. The MA and the trend line.
- There is also still an open gap from June 26th which bulls need to close next week.
- The bulls have a strong breakout and are expecting a second leg. But they have not broken the trendline yet. Wedge reversals usually have 2 legs, so the next one should break the TL.
- The bulls need to convert the daily into a trading range. A break above the July 3rd swing high will be needed.
- They want a larger MTR, so expect a HL or LL to swing from.
- The pain trade here would be an even stronger 2nd leg – trapping bears covering their shorts and expecting a test of the lows.
- If you look left you can see in March that they got a chance to cover them at the lowest close.
- Expect sideways to up next week.
Market analysis reports archive
You can access all weekend reports on the Market Analysis page.