Market Overview: FTSE 100 Futures
FTSE 100 tight trading range with market moving sideways last week as traders decide on a direction. We have had at least 2 breakouts in either direction so we can expect more sideways trading next week. It is a tightening range on the daily which is favoring limit order traders so most beginners should trade small until it is more clear.
FTSE 100 Futures
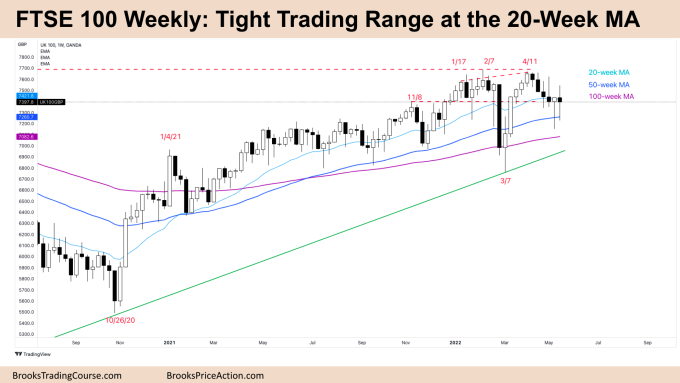
The Weekly FTSE chart

- The FTSE 100 futures index traded slightly higher last week with a small bearish doji with large tails above and below. It is a tight trading range and the 4th consecutive doji. I could not find another example in recent history.
- That means it is unusual but also that it is breakout mode. 80% of breakouts fail and failures fail! So the probability is 50% either way and traders should expect multiple failed breakouts before a clear direction
- We said last week was a possible High 2 and it raced up at the start of the week, collapsed back down Wednesday and Thursday to finish back where it started.
- The bulls see a pullback from a 6-week bull channel up to the range highs and stalling at the 20-week moving average (MA)
- It was a failed High 2 so they will look for a successful High 3 or wedge buy at the moving average which is a higher probability trade.
- The bulls see a micro double bottom with the past 2 weeks for a move back up but the math is bad.
- The bears see a failed High 2 and Low 2. But the math is slightly better for the bears as it’s closer to the top third of the range for selling – less risk, more reward, but lower probability.
- Bears expect a reversal down from a wedge top to have 2 legs but we may have already had the second leg down. That is the problem for beginners trading a tight trading range.
- If the bears get a follow-through bar next week they can move down to the lows of the range.
- But with traders buying below bars and selling above we will likely go sideways next week again.
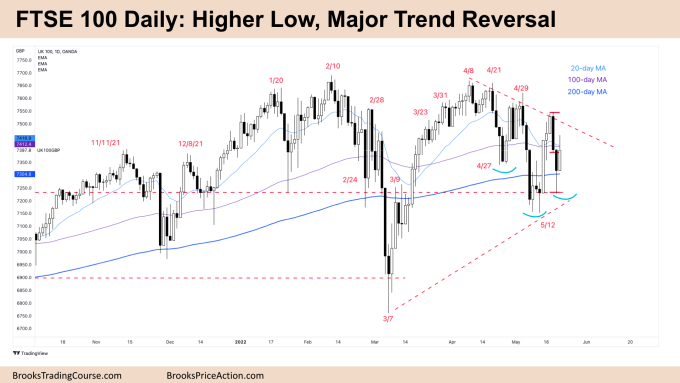
The Daily FTSE chart

- Friday’s FTSE 100 futures index was a bull bar with a large tail on top.
- The weekly bar closed within 30 points of the open after 2 days up and 2 days down. It is a tight trading range which is breakout mode. it is a 50% probability up or down.
- If you look at a chart and it’s hard to read, think confusion, think trading range. So buy low sell high and scalp (BLSHS).
- Friday makes a two-bar reversal, in between the 200-day MA and 20-day MA. So it’s breakout mode and a lower time frame triangle.
- We might be always in short on the daily with lower highs of the range, but it’s reversing every 2 bars.
- For the bulls, it’s a possible higher low major trend reversal. It is a possible double bottom with May 12th. The bulls are looking for a High 2 buy near the moving average.
- You could call it an inverse head and shoulders pattern. It is slightly sloping but most patterns are not perfect, so traders will trade them like that anyway.
- The bears see a pullback and will look to sell a Low 1 down to the prior lows. They see the strong bear bars as always in short and expect to scalp out at the double bottom.
- The problem is the context. Big bars means big risk and low return. Bulls might wait to buy lower. If you’re a bear, your stop is also far away. You will likely sell higher as well.
- And bears have been selling at the moving average above and making money. Markets have inertia so we can expect them to keep going until they stop making money doing it.
- Limit bulls and limits bears will continue to trade this tightening range until we get some kind of catalyst for a breakout in either direction.
Market analysis reports archive
You can access all weekend reports on the Market Analysis page.