Market Overview: FTSE 100 Futures
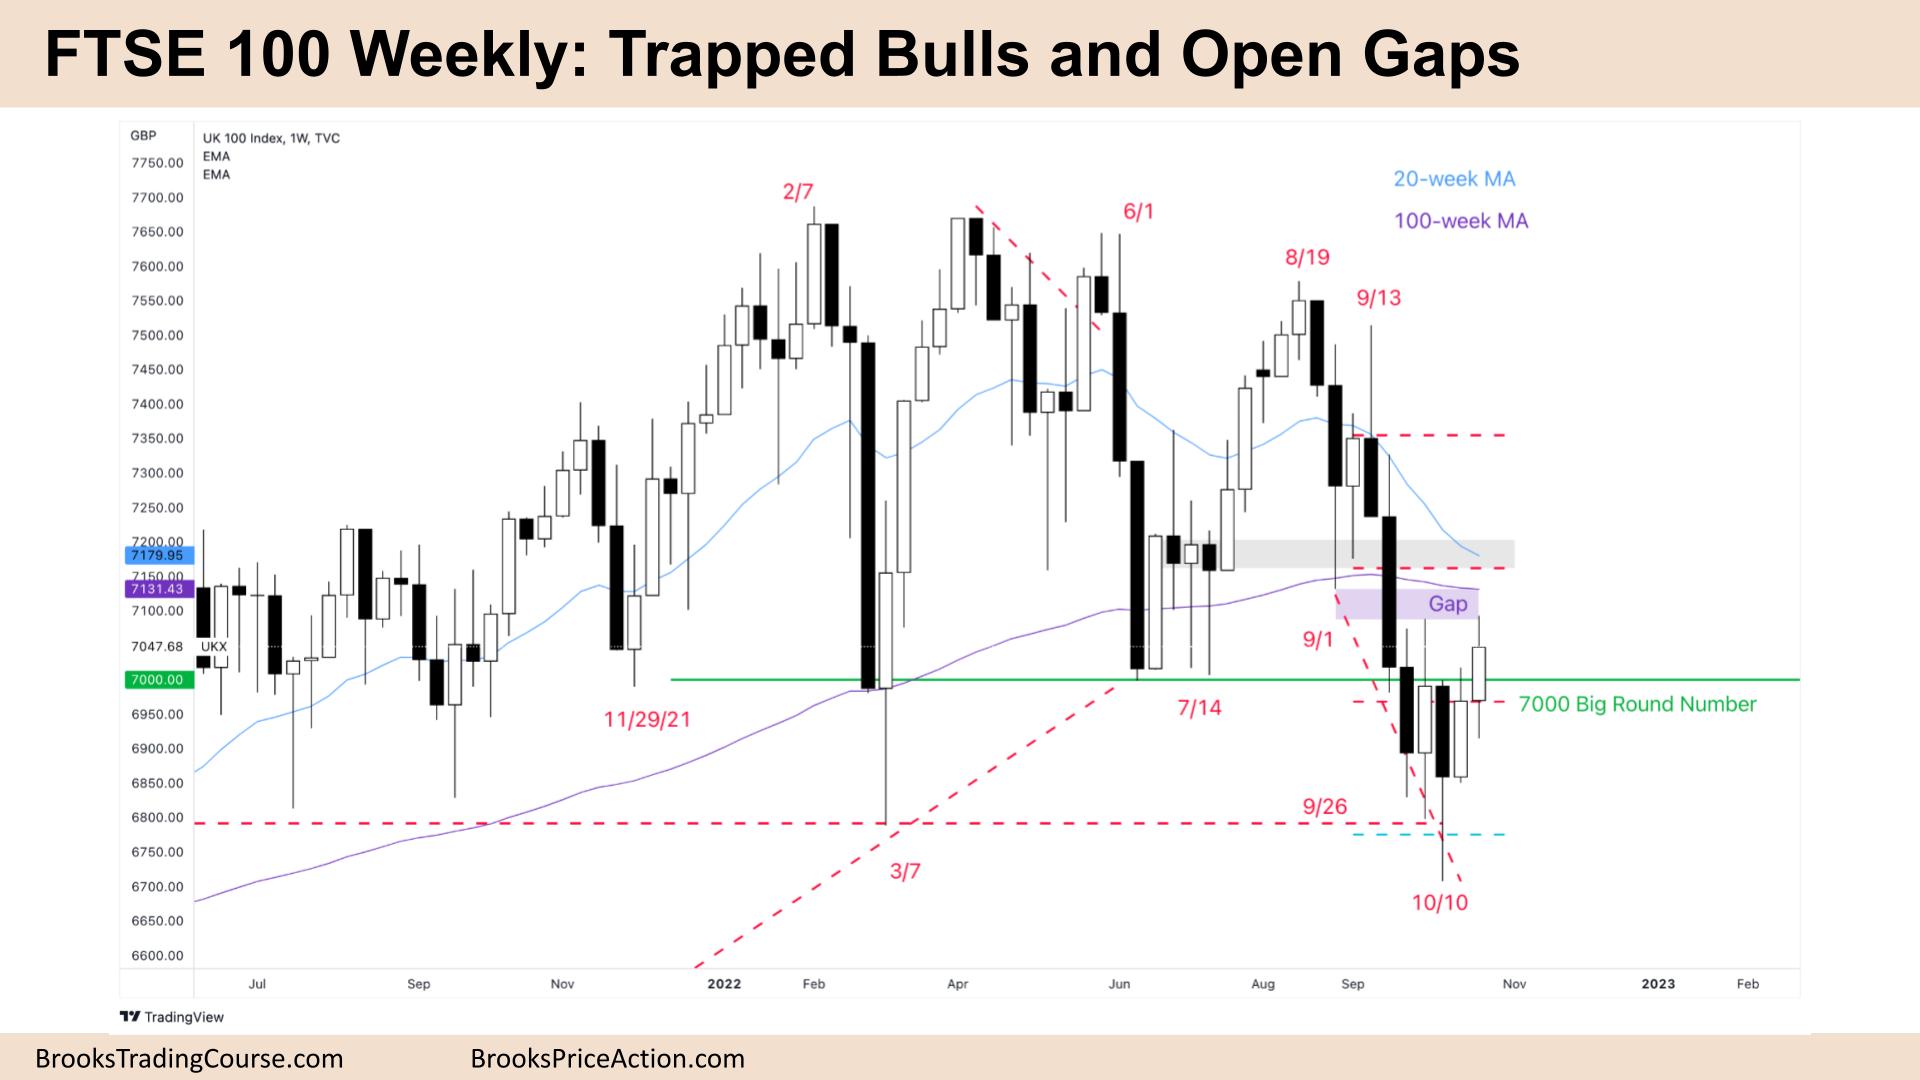
The FTSE futures market moved higher last week with trapped bulls and open gaps low in a trading range. The bulls see a second entry long at the bottom of a trading range and a failed breakout below the 7000 big round number. The bears see a tight bear channel and possible moving average gap sell above. It could move up quickly to close the gap next week, but it’s likely to be met with the sellers above.
FTSE 100 Futures
The Weekly FTSE chart

- The FTSE 100 futures was a bull bar closing above its midpoint with tails above and below. We likely have trapped bulls above.
- It is the second consecutive bull bar, but both bars have tails above, so it is not clearly always in long. Some bulls will wait for a 3rd consecutive bull bar.
- For the bulls, it is a High 3 buy signal. The bulls see a possible parabolic wedge with Sept 1st, 26th and October 10th.
- They see a failed breakout below the 7000 big round number and the bottom of a trading range.
- But all the largest bars to the left are bear bars. The bears got a new low of the year below March 7th. They want a measured move out of that range, likely from the September 13th high.
- The bulls also see the 18-month trading range and limit bulls have been making money buying down here and scaling in lower on the failed breakout of the range. So far, they have been right.
- For the bears, they see a tight bear channel, trapped bulls with three pushes down and expect two legs sideways to up to the moving average, where they will likely sell again, trading the trend resumption.
- The bears created a gap between September 1st and this week, so as long as it remains open, it is not as bullish as it could be.
- Bulls got trapped on September 13th and a reasonable short would be the 50% zone between the top of the bull bar on September 6th and October 10th.
- A second entry-long low in a trading range is a high probability setup, and it is more likely we will go sideways to up next week.
- But both bull bars have tails, so limit order bears are scaling in, and bulls are not swinging. They might be waiting for a stronger bull bar closing on its high to buy above.
- Trading ranges are full of disappointment, so there might get a big bull bar next week, which will close the gap but be too high for a bullish follow through. The bears might get a reversal bar with a tail below so that it would be a bad sell signal.
- It is reasonable to expect us to go sideways at the 7000 big round number.
- If you had to be in, it is better to be either long or flat. Always in bears would have exited after the second opposite signal.
- There isn’t anything to sell yet, but you could structure a trade around the moving average which is next to the very tight trading range to the left, a stop above there or September 13th.
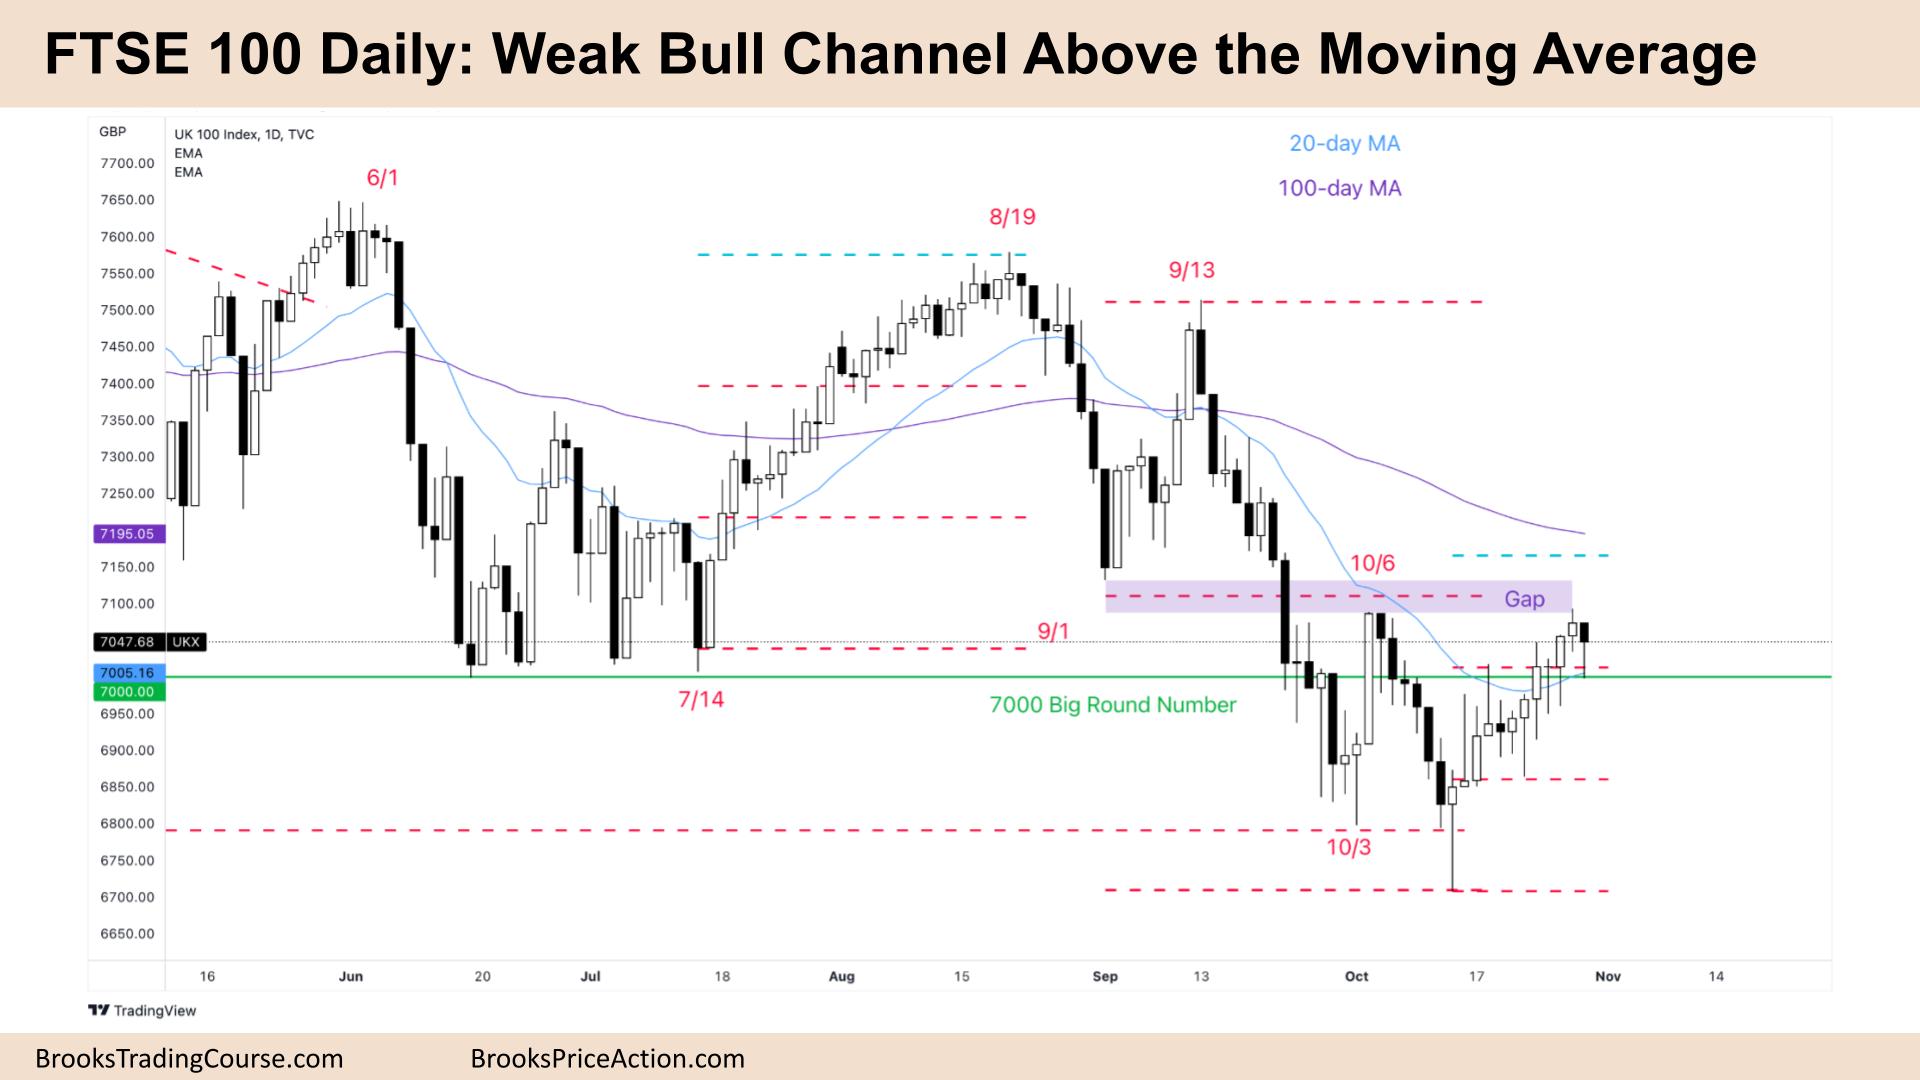
The Daily FTSE chart

- The FTSE 100 futures was a small bear bar with a tail below it on Friday.
- It is a weak bull channel high in a trading range with many bars overlapping and having small bodies.
- For the bulls, it is two pushes up from a lower low major trend reversal. It is a failed breakout below the 7000 big round number and the bottom of a trading range.
- The bulls also want to close the gap above and want a higher low to set up a measured move above the 100-day moving average (MA. We are always in long, but it’s not a high probability buy yet.
- We have been sideways for a few weeks, so they are likely to get disappointed.
- The bears see a 20-bar moving average gap bar sell – the first bar in many days to go above the 20-day moving average. But it’s a bad sell signal. Bears might wait for a second signal or consecutive big bear bars closing on their lows before shorting and scaling in higher.
- The bears see an open gap, so trapped bulls, a broad bear channel and an absence of consecutive big bull bars closing on their highs, so limit bears are making money. If limit bears are making money, then the bull trend is not strong.
- Because of the number of consecutive bull bars, the first reversal will probably be minor and will likely go sideways at the 7000 big round number.
- If you had to be in, it’s better to be long or flat. Exit below a bear bar closing below its midpoint. For now probably more buyers than sellers below Friday and sellers at the moving average and above.
Market analysis reports archive
You can access all weekend reports on the Market Analysis page.

