Market Overview: FTSE 100 Futures
The FTSE futures market moved higher last week with a weak signal bar that turned into a strong bull BO. We said last week the pain trade might trap traders and it did. The bears wanted the LH and break below but too much buying pressure at the higher MAs below. Bears want a failed BO above the LH for a HH DT bear flag.
FTSE 100 Futures
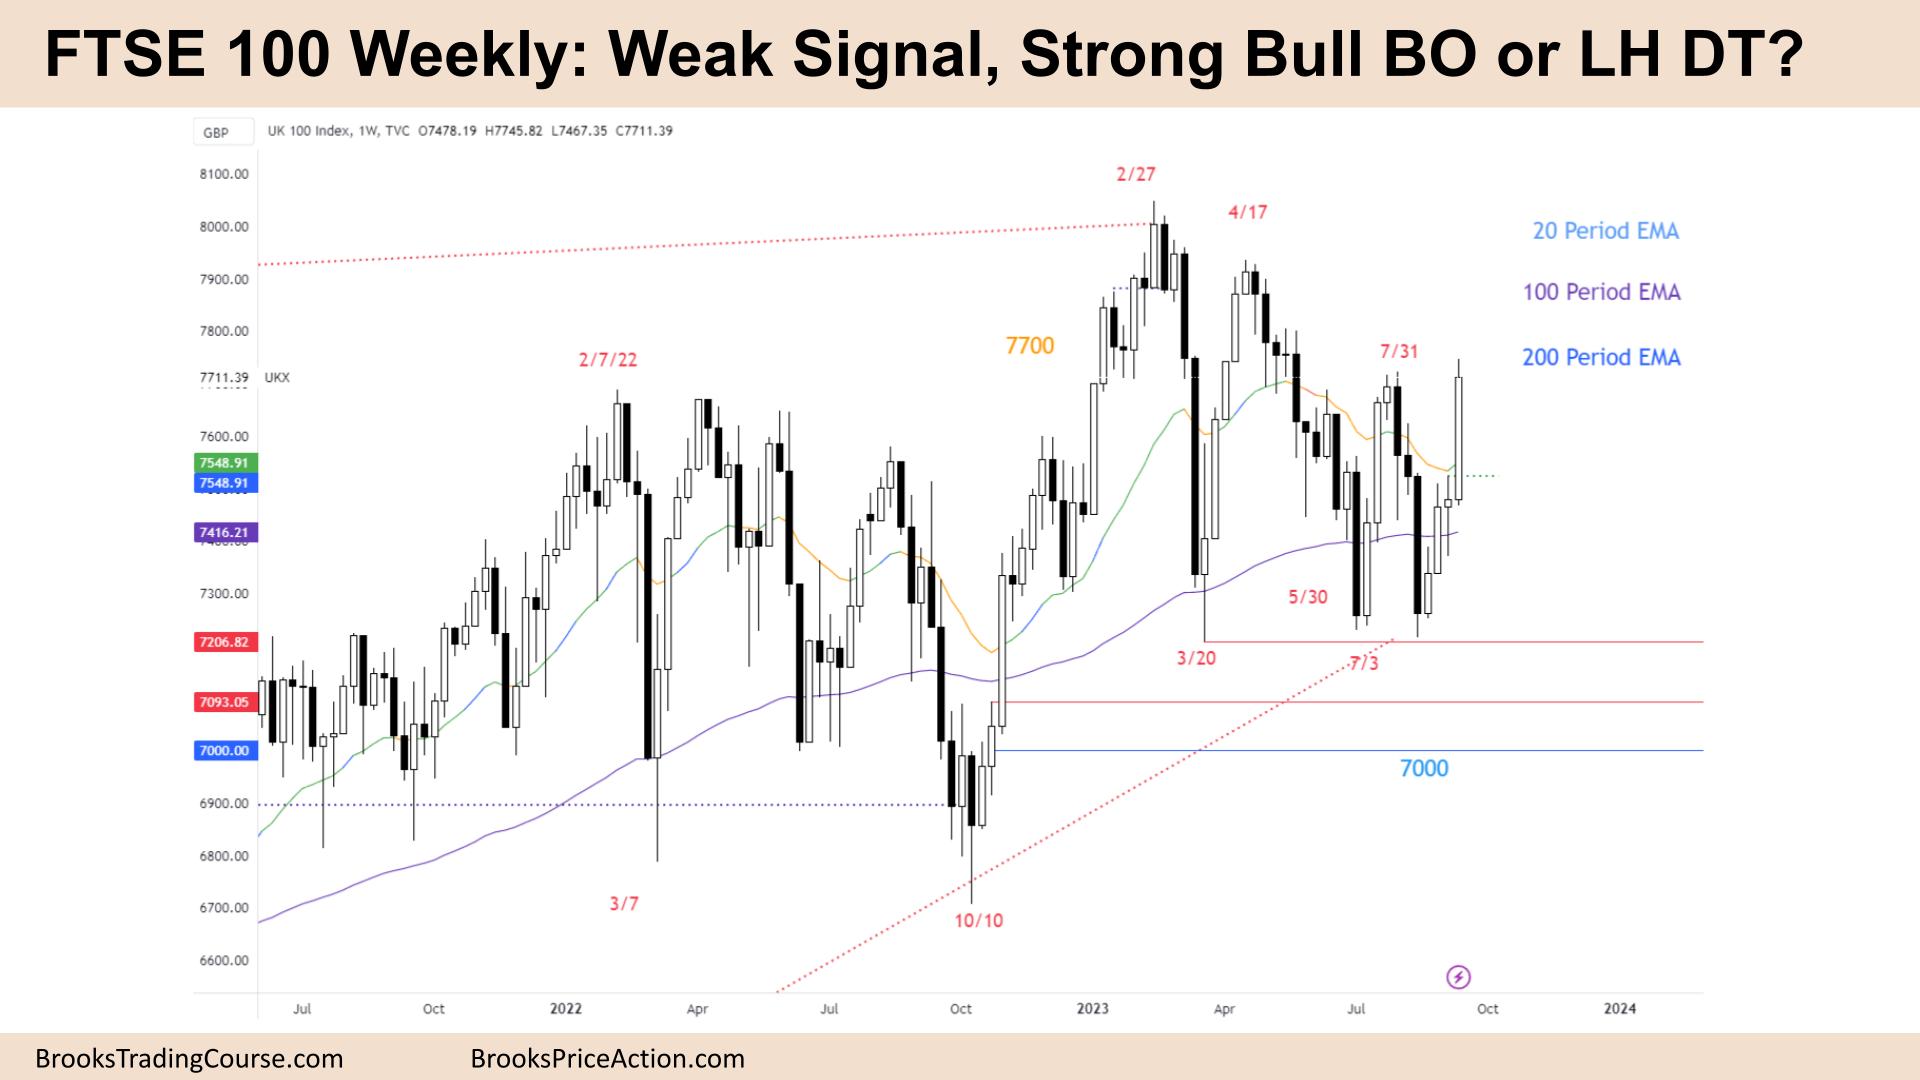
The Weekly FTSE chart

- The FTSE 100 futures moved higher after a weak signal bar and a strong bull BO closing near its high. We might gap up on Monday.
- The bulls see a double bottom and expect two legs sideways to up.
- They wanted a strong FT bar, and they got it.
- It’s a bull microchannel, 4 bars without going below the low of a prior bar, so the first time to do that, traders will expect buyers to be there.
- The bears see an expanding triangle – a LL after July and now a HH above July – in a trading range.
- The bears want a good sell signal to short, but most traders should be long or flat.
- There are many layers of buying support – the high of the doji from 2 weeks ago, the MA and 50% of this week’s bar.
- But with a strong BO, most traders will expect more up.
- On July 31st there was a bull spike that collapsed, so potentially a magnet there.
- The bears also see the original bull spike from March, and where it collapsed was at the then-MA. Support turned to resistance when we broke through and now it is a magnet as well.
- This move started from an inside bar, which reduces the probability of it starting a big move without some test backdown.
- Traders should expect to pull back slightly next week before going above the high.
- it is the 4th consecutive bull bar so this will create a layer of support even it we move back down.
- We are also testing the last time we went always in long back in July.
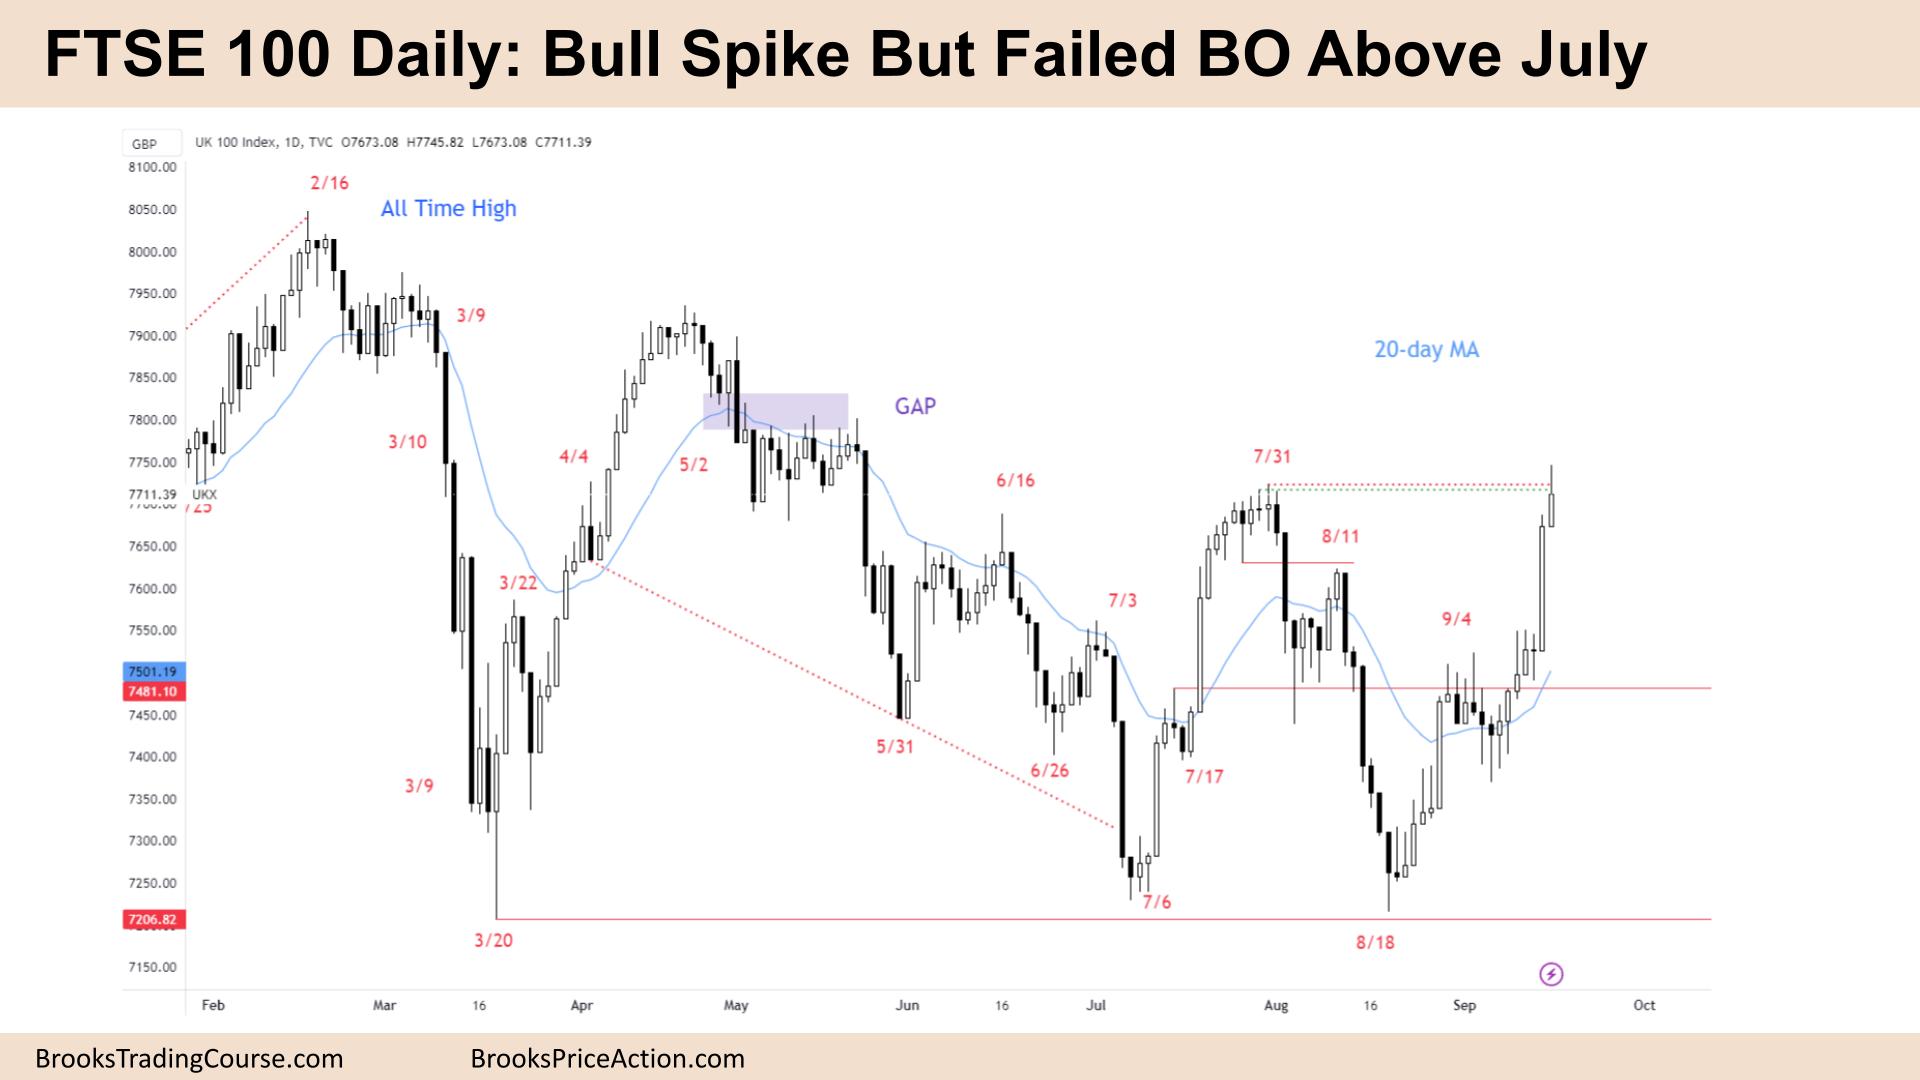
The Daily FTSE chart

- The FTSE 100 futures moved higher in a bull spike last week and finished with a bull bar closing just above its midpoint on Friday.
- The bulls want a breakout and a bull follow-through bar, a close above July.
- But trading ranges are disappointing for traders, so we should expect it to go sideways here next week.
- The bears see a LH DT and open gaps above – around 7850 which the bulls are going to target to close.
- Open gaps are signs of a trend, and closed gaps are signs of at trading range.
- It was a weak signal bar on Wednesday and a strong move on Thursday, which trapped traders.
- The traders who faded such a big bar, now have a decision to make. Because it got FT the probability is a second leg higher.
- But with a big tail, some limit order bears will scale in with a wide stop, betting they can return to their first entry.
- Most likely, support areas are above the August 11th high (Sell climax high), mid-Thursday and the high of Wednesday.
- Most bears would have covered during the move, while others will sell higher, trying to get back to the midpoint of Thursday.
- It is a bull BO, so okay to be long or wait for a pullback to enter. Traders can also trade small and add-on if successful.
Market analysis reports archive
You can access all weekend reports on the Market Analysis page.