Market Overview: FTSE 100 Futures
The FTSE futures market formed a possible FTSE head and shoulders top on the weekly chart. The bulls want a High 1 buy above the pullback, but they might wait for a better entry bar. The bulls want a strong close or double bottom above the prior trading range high from 2022. The bears have a chance to break back inside that range with a lower high. Next week should be sideways to down.
FTSE 100 Futures
The Weekly FTSE chart

- The FTSE 100 futures last week was a bear bar closing below its midpoint (but it’s hard to tell from eyeballing it.)
- It looks like a head and shoulders top, which could lead to a measured move down.
- It closed below last week’s bear bar, so traders who sold last week made money.
- It’s a bear bar, so it’s a sell signal and is the second consecutive bear bar – although both have significant tails.
- The tail below is large, so it’s a bad stop order sell, which means it is a good limit order buy – most traders should wait for more information.
- The bulls see a strong 5-bar bull micro channel and expect a second leg up.
- The bears see a lower high double top, a possible head and shoulders top and are looking for a break below and a possible measured move down.
- The bulls see we have a gap of exactly 4 points above the high of the prior 18-month trading range from Feb 27th.
- Although small, that could be important. If bulls can get close to keeping that gap open, the bears will start to give up, and bulls will get a second leg higher.
- After such a strong spike, both traders expected to buy at the moving average. The bulls want this to be a spike and channel bull trend, and we just ended a pullback. They are looking for the High 1 buy.
- The bulls also see the open gap above the doji, which kicked off the move and will act as support. Bears want to close it to keep the price in a trading range. In trading ranges, gaps close, while in trends, they stay open.
- The sell climax disappointed the bulls in March, so they scaled in lower and exited back at their original entries – limit bulls are making money.
- Bears need one more bar to get the always-in bulls to exit – they will get out below a strong bear bar.
- Expect sideways to down next week with buyers below the lows. It might form a larger bull flag pattern.
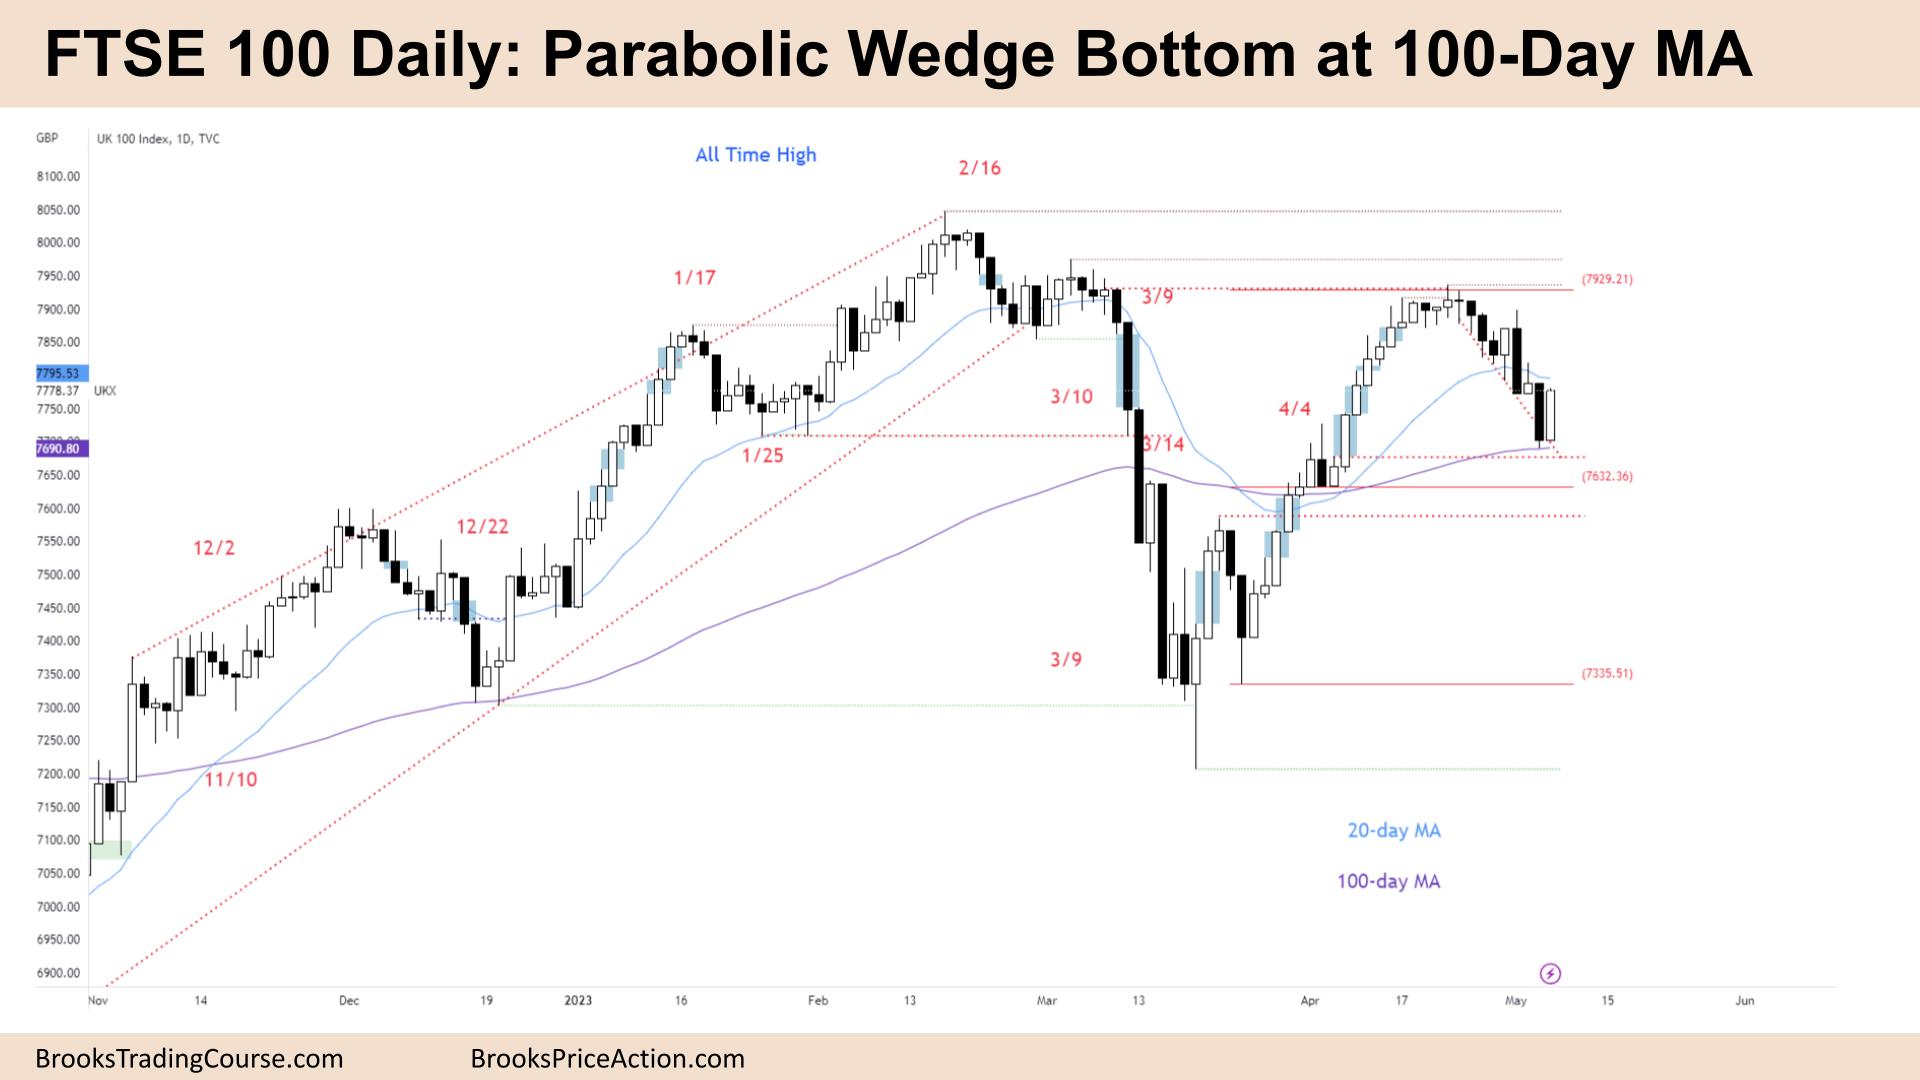
The Daily FTSE chart

- The FTSE 100 futures went up on Friday with a bull inside-bar in between the 20-day and 100-day MA.
- It is a bull bar closing on its high, so it’s a High 2 buy, but inside bar BO’s have a high failure rate.
- The bulls see the 20-bar MA Gap bar buy failed on Wednesday, and the bulls scaled in below it to get out with a profit.
- It’s three pushes down, a parabolic wedge bottom so that traders will expect 2 legs sideways to up.
- The bears want to break below the wedge and get back to the start of the spike and channel from the end of March.
- The lack of sellers below Thursday’s low is concerning for the bears. They might wait for a pullback to sell higher – a reasonable place would be at the failed High 1 area above.
- The bulls see a pullback from a very strong move and want a second leg of that whole move from April.
- But we’ve been going sideways for 6 months, and we are near the midpoint, so the probability is closer to 50/50.
- Bulls need to break a trendline before buying – stop going down, start going sideways, and then buy.
- Bears will likely sell a scalp above this bar for a move back to the prior breakout point and close the breakout gap.
- It is a better buy above, so limit bears might wait.
- Because the bull move was a type of wedge, the pattern might need to complete to test the start of leg 3, which is one more bar down.
- There are gaps above and gaps below – we will probably close both – but not sure in which order – up first, then close low by Friday.
- Because it’s a trading range, we might do both. Expect sideways to down next week.
Market analysis reports archive
You can access all weekend reports on the Market Analysis page.