4th day in pullback from Emini parabolic wedge buy climax
I will update again at the end of the day.
Pre-Open market analysis
Yesterday was a trading range day and an inside day. It is the 3rd bar in a tight trading range after a parabolic wedge buy climax. Traders are deciding whether a 2 week pullback has begun or if there will be one more new high before the pullback begins. In either case, the daily chart will probably be sideways to down for a couple of weeks, even if there is one more new high first.
Because yesterday was the 4th day in a pullback, it is a buy signal bar for today. But, it was not a big bull bar closing near its high. It is therefore a weak buy setup. There might be more sellers than buyers above its high.
Today is Friday and therefore weekly support and resistance can be important. This is especially true in the final hour. The bulls want the week to close near its high and the bears want a close near the low. There is no other nearby significant support or resistance.
Overnight Emini Globex trading
The Emini is up 21 points in the Globex session. Today will probably gap above yesterday’s high. That would trigger the buy signal on the daily chart. Despite the parabolic wedge buy climax, the daily chart is still in a strong bull trend. In addition, the December 12 top of the crash is a magnet above. Consequently, there is an increased chance of a bull trend day today.
If there is a big gap up, there is only a 20% chance of a strong trend from the beginning that will last all day. There is an 80% chance that any early trend will have a reversal. The bulls will look for a double bottom or wedge bottom near the EMA for a swing up. However, the bears want a double top or wedge top, and hope it will be the high of the day.
Yesterday’s setups

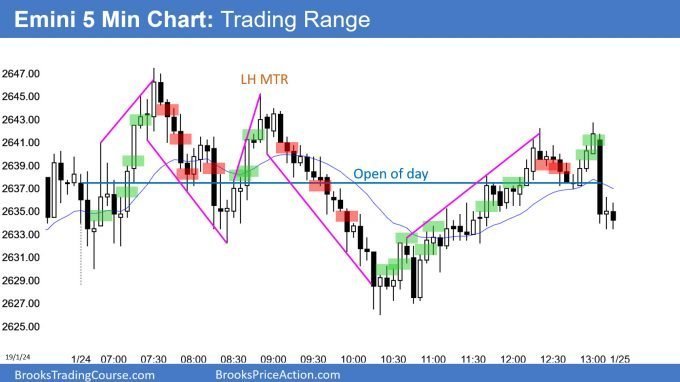
Here are several reasonable stop entry setups from yesterday. I show each buy entry with a green rectangle and each sell entry with a red rectangle. I rarely also show limit order entries and entries on the close of bars. My goal with these charts is to present an Always In perspective. If a trader was trying to be Always In or nearly Always In a position all day, and he was not currently in the market, these entries would be logical times for him to enter.
EURUSD Forex sell climax at bottom of 4 month trading range

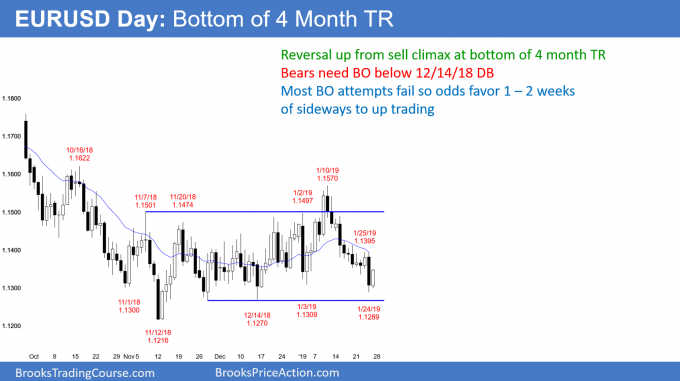
The EURUSD daily Forex chart had a big bear breakout below a higher low yesterday. However, today so far is reversing that selloff. There have been many strong breakout attempts over the past 4 months. This is typical in a trading range. However, 80% of breakout attempts fail. It is therefore better to bet on reversals. Traders buy low, sell high, and take profits near the other extreme.
If today closes near its high, it would be a buy signal bar. The odds would then favor 1 – 2 weeks of sideways to up trading.
The bears need a strong break below the December and November lows before traders will believe the 2018 bear trend is resuming. Until then, traders will bet on reversals.
Overnight EURUSD Forex trading
After yesterday’s big bear day, the EURUSD 5 minute Forex chart reversed up in a tight bull channel overnight. Because the channel is tight, the bears will probably have to stop the buying and begin a trading range before they can get a swing down. Consequently, the chart will probably be sideways to up for the rest of the day.
The close is important because today is a buy signal bar on the daily chart. If the bulls can close today near its high, traders will be more willing to buy over the next couple of weeks. The bulls will therefore buy 20 – 30 pip selloffs today.
The bears want the bar on the daily chart to have a big tail on top. That would be a weaker buy signal bar for tomorrow. It would therefore give the bears hope that the 3 week selloff will break below the 200 pip range.
However, since trading ranges resist breaking out, today will probably close near its high. Most bears want to sell in the upper half of the 200 pip range. Those selling today will probably only scalp.
In addition, because of the shortage of bears here, today will probably close near its high. It will therefore be easier to make money buying pullbacks than selling rallies.
Summary of today’s S&P Emini futures price action and what to expect tomorrow

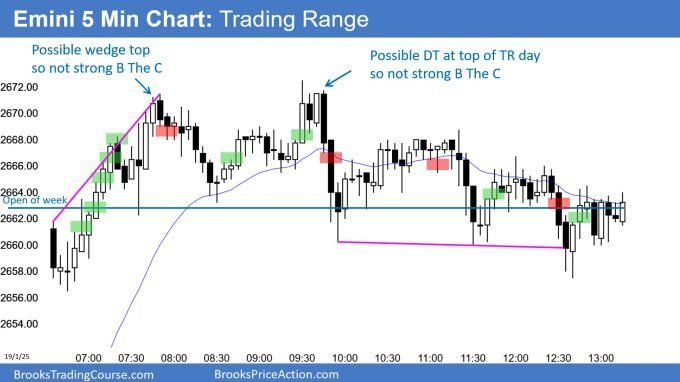
Here are several reasonable stop entry setups for today. I show each buy entry with a green rectangle and each sell entry with a red rectangle. I rarely also show limit order entries and entries on the close of bars. My goal with these charts is to present an Always In perspective. If a trader was trying to be Always In or nearly Always In a position all day, and he was not currently in the market, these entries would be logical times for him to enter.
End of day summary
The Emini gapped up, rallied briefly, and then entered a tight trading range. It closed the week just above the open. This week is therefore an inside bull doji bar on the weekly chart. After a 4 week rally, that is a High 1 bull flag.
But, it is a doji at the 20 week EMA, and therefore a weak setup. In addition, the resistance of the December 12 crash high is just above. Therefore, there are probably sellers not far above this week’s high.
See the weekly update for a discussion of the price action on the weekly chart and for what to expect going into next week.
Trading Room
Traders can see the end of the day bar-by-bar price action report by signing up for free at BrooksPriceAction.com. I talk about the detailed S&P Emini futures price action real-time throughout the day in the BrooksPriceAction.com trading room. We offer a 2 day free trial.
Charts use Pacific Standard Time
When I mention time, it is USA Pacific Standard Time (the Emini day session opens at 6:30 am PST, and closes at 1:15 pm PST). You can read background information on the intraday market reports on the Intraday Market Update page.
Al, can’t say you how thankful I am that I found you. Been your student for last 2 years. Two words – life changing. And I’m only in my early 20’s. Countless hours of grinding and learning from every material you have provided have transformed my life. And I still want to learn and watch these price action videos, read articles over and over again each day.
As I look back now, I think the hardest part was realizing and getting to the point where you see that all of these trading methods actually work. After countless times buying top of trading range and selling all bottoms of trading ranges and betting on reversals in tight channels, it’s good feeling now to took at market and say – yes, once I used to do all these silly ignorant things. I still remember you telling in one of the webinars or videos – “I’m speaking a lot about setups, bear and bull case, probabilities, risk/reward…it might be hard to understand me at this moment, but when you see yourself that everything I’m talking about works, you will be amazed.” And it’s completely true. I think all of students who are constantly profitable can agree with me here – when you get to the point at which you understand and are able to read price action quite good, making money is not so hard. You just need to be humble and respect markets. Price is truth!
Hi Roberts,
Thanks for your heartfelt and lovely words for Al and his methods. Your words are so true for so many successful price action traders out there. Al has read your note and is very happy that you are finding his information useful.
Would you be Ok with me copying this into the Testimonials area? Here, it will get progressively deeper into site content as time goes by.
Also, I am planning on putting up video testimonials. Would you be able and willing to create a short video simply talking through what you have written above? I also invite any members out there wanting to provide a short video testimonial, no need for long complicated productions! : )