Day trading an August stock market bear trend
Updated 6:55 a.m.
The Emini had consecutive outside days within a tight trading range. Hence, there is resistance to breaking out above or below the prior day. An outside day, especially within a tight trading range, increases the chances of an inside day. Consecutive outside days increase the chances that a breakout above or below the prior day will fail and reverse.
The odds are that today will not be a big trend day up or down. Yet, most of the days within this 11 day tight trading range have had swings up and down. The best indicator of what the bars to the right will look like is the appearance of bars to the left.
While the Emini will breakout of this range at some point, the odds are that most breakout attempts will continue to fail. As a result, traders will continue to buy low and sell high. The selloff from yesterday’s lower high is strong enough to lead to a bear trend day. It is more likely only going to lead to a bear leg in a trading range.
At the moment, the Emini is reversing up from above yesterday’s low. While this might be the low of the day, a reversal up from a tight bear channel is usually minor. This means that the best the bulls will probably get on their first rally is a trading range. If today is going to be an inside day, the reversal up might eventually test near yesterday’s high.
The odds are that today will not be a strong trend day, but it will probably have a swing up and down. The Emini is Always In Long, but the bulls need to get above yesterday’s high if today will be a strong bull trend day. It will probably not be a bear trend day.
Pre-Open Market Analysis
While the Emini has been in a tight trading range for 10 days, the growth of the range reduces the probability of a bull breakout. Although the odds still favor the bulls, a bull breakout will probably be limited to a few days.
As a result of the Emini being as overbought as it currently is, the bulls have to reduce their position size. Because the stop is now so far away, it creates a risk that is unacceptable for many firms. Hence, bulls will probably use a bull breakout as an opportunity to take profits at a good price.
Yesterday turned down from within 2 ticks of the all-time high. It also ended the day with a Lower High Major Trend Reversal. Yet, it is still in a 10 day tight trading range. Hence, sideways is more likely than a successful breakout up or down. There are now consecutive outside days, yet that adds nothing to traders. It probably increases the chances of the breakout coming soon.
Emini Globex session
While the overnight range was big, the Emini is currently unchanged. The day session is still in breakout mode.
Forex: Best trading strategies
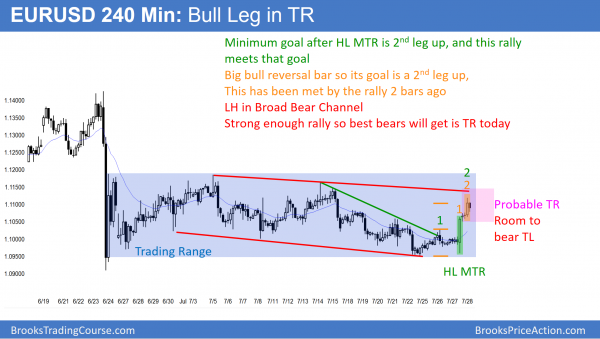
The 4 hour EURUSD Forex chart shows a rally up from a Higher Low Major Trend Reversal (HL MTR) at the bottom of the trading range. The goal after a HL MTR is a 2nd leg up, and the EURUSD is having a 2nd leg up. The bull reversal last night was strong enough to have a 2nd leg up as well. The rally of the past 2 hours qualifies. While there is still room to the bear trend line above, the consecutive buy climaxes up from the low will probably lead to a trading range soon.
The daily chart of the EURUSD Forex market has had 2 legs down in a trading range over the past month. Because the EURUSD is at the bottom of the range, the probability favors the bulls. The bulls had a small buy signal bar 3 days ago, and the EURUSD rallied more overnight. Yet, the bulls have been unable to rally strongly to convince traders that this is more than a leg in the trading range. Therefore, the bears still have a 50% chance of a bear breakout below the month-long, 200 pip tall trading range. The bears see the rally as a bull leg in a Broad Bear Channel.
EURUSD Forex targets
The target for breakout traders is a measured move up or down, based on the 200 pip height of the range. Because the EURUSD is in Breakout Mode, the probability that the 1st breakout will be profitable is 50%. Hence, there is a 50% chance that the breakout will reverse. If the reversal is strong, the market will usually then try to breakout in the opposite direction.
There is no breakout yet. The location is good for the bulls, while the month-long bear trend is good for the bears. Yet, the lack of momentum down means that the selloff is probably a bear leg in a trading range rather than the start of a bear breakout.
Summary of today’s S&P Emini futures price action and what to expect tomorrow
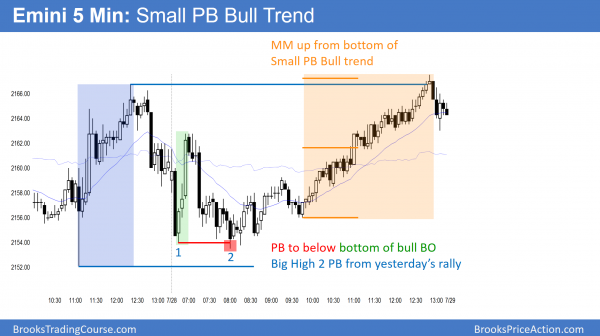
Yesterday was an outside day, which increased the chances of today being an inside day. The Emini rallied from a double bottom test above yesterday’s low, but stayed below yesterday’s high. Hence, it was an inside day. The selloff to the low of the day was just a pullback from the initial rally. This is true despite it falling below the initial bull leg. Today was a Small Pullback Bull Trend for the 2nd half of the day.
The Emini is in an 11 day tight trading range, and therefore in breakout mode. The breakout can come at any time. A bull breakout will probably fail within a few days because the Emini has rallied too many bars without a pullback. Many institutions want to reduce risk, which means they will start to take profits.
See the weekly update for a discussion of the price action on the weekly candlestick chart and for what to expect going into next week.
Traders can see the end of the day bar-by-bar price action report by signing up for free at BrooksPriceAction.com. I talk about the detailed S&P Emini futures price action real-time throughout the day in the BrooksPriceAction.com trading room. We offer a 2 day free trial.
When I mention time, it is USA Pacific Standard Time (the Emini day session opens at 6:30 am PST, and closes at 1:15 pm PST). You can read background information on the intraday market reports on the Intraday Market Update page.


Hi Al,
for today in ES I see when calculating the measured move target you start not from the low of the day but from a higher low – are there any clues as to when to draw from the extreme of the day, compared to when to choose a higher low or lower high as the starting point?
Thanks!
I always use the closest target 1st. Here, the Small Pullback Bull Trend began at a higher low.
Hi Al,
I’ve been trading the ES about a year and your course has greatly helped me become consistently profitable.
Usually in these TR days, I patiently BLSH scalp and scale in if needed. I just felt the past couple of days have been tough with the way PA has been behaving…with huge bars, lack of follow-throughs and small pullbacks.
In your experience, would you consider days like these as anomalies? Appreciate your thoughts.
Thanks.
Nothing is an anomaly, per se. However, look at the daily chart. There is an 11 day exceptionally tight trading range, which is unusual. That creates unusual intraday price action. I don’t know if you were in the Trading Room today, but I talked a lot about the abrupt reversals. There is logic behind each one.
Hi Al,
On EU hourly chart, there is a gap between 1.1076 breakout point and 1.1079 test of breakout. How will we use this gap to project measured move? Will we calculate from 1.1050 to 1.1076 and project that above 1.1078 giving us 1.1104 as target? As price already went above that level before retesting so does that mean that measured move projection is not relevant in this case?
Many Thanks
Saad
Once a target is hit, it becomes much less important, but sometimes the market hangs around it for a while.