Emini 10 percent correction but monthly bull flag
Updated 6:45 a.m.
The Emini gapped up on the open, but the gap was small. Moreover, the 60 minute moving average, and yesterday’s high and close were magnets below. Finally, this early rally is forming a wedge top with the 2 highs from Friday. Unless the bulls can get consecutive big bull bars soon, the odds are that the Emini will fall to support below. Furthermore, a wedge top usually transitions into a trading range. Therefore, there is an increased chance of a trading range for the 1st couple of hours today.
Since Friday closed near its open, it was a doji day. That increases the odd for additional doji days early this week. Yet, the Emini is Always In Long, and likely to trend higher this week.
Pre-Open market analysis
Friday reversed up strongly and now is a High 2 buy signal bar with Wednesday’s high. However, the selloff was so strong that the bull trend will probably not resume for at least a month. The Big Up in January and the Big Down in February creates Big Confusion. The odds favor a trading range on the daily chart. Yet, this 10% correction will lead to a new high within a few months.
Friday is a tradable bottom for a 1 – 2 week rally up to above Wednesday’s high. This would be about a 50% bounce. The bears will sell it for a leg down in the developing trading range. There is at least a 50% chance that last week will be the low of the bull flag on the monthly chart.
Overnight Emini Globex trading
The Emini is up 29 points in the Globex session. It therefore might gap up today. While it could have one more push down to a wedge bottom on the 60 minute chart, the two strong reversals last week make a rally likely for the next week or two. There is an increased chance of bull trend days this week.
Since a trading range is likely over the next month, the rally will likely be a bull leg in a trading range. However, even if the Emini goes sideways for a month, the odds are that it will be at a new high within a few months. It could get there within a month. Because a bull leg in a trading range is more likely than an immediate resumption of the bull trend, there will be something wrong with the rally. For example, it could have big bull bars, but not consecutive big bull bars. Alternatively, it could have several small bars, and some will be dojis or have bear bodies.
There is always a bear case. Yet, there is only a 20% chance that this selloff is the start of a bear trend on the monthly chart. A trading range is more likely. The bears need consecutive big bear days falling below last week’s low to improve their odds.
Friday’s setups
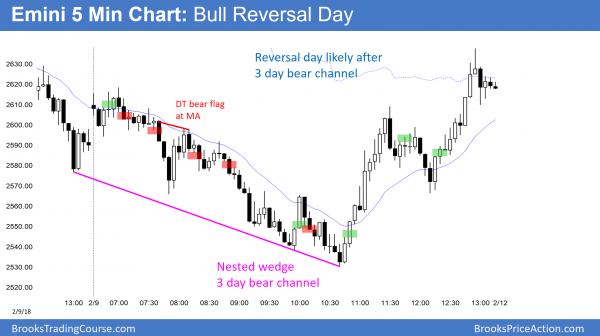
Here are several reasonable stop entry setups from Friday. I sometimes also show limit order entries and entries on the close of bars.
EURUSD selloff is within 100 pips of starting a 1 week rally
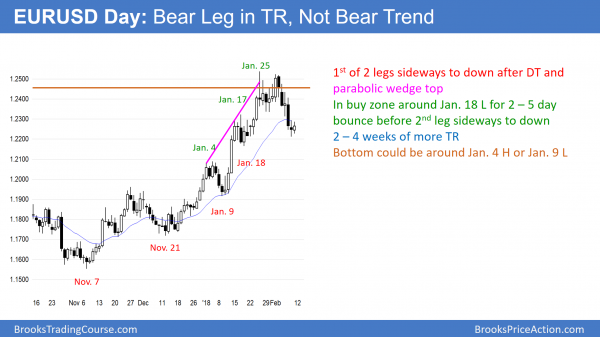
The EURUSD daily chart had sold off for 7 days in a trading range that began on January 16. It should fall below the January 18 low before beginning a rally for 1 – 2 weeks to a lower high.
The EURUSD daily Forex chart has fallen for 7 days. It traded above Friday’s high overnight in an attempt to form a double bottom with the January 18 low. However, that is the 1st pullback in 7 days. Hence it was in a bear micro channel. The bears usually sell the 1st pullback. Consequently, there are probably more sellers than buyers above Friday’s high.
The year long bull trend is probably transitioning into a 2 – 3 month trading range. Therefore, the legs up and down will usually go beyond support and resistance before reversing. The January 18 low is a major higher low and therefore support. Since the selloff is in a tight bear channel and near support, the odds are that it will fall below this week. Since a trading range is likely, there will probably be buyers below and around the January 4 high or the January 9 low. The bulls will then create a 1 – 2 week bull leg in what will probably be a trading range.
Less likely, the daily chart has entered a bear trend on the daily chart. Yet, without consecutive big bear bars falling far below support, that is unlikely.
Overnight EURUSD Forex trading
The EURUSD 5 minute chart sold off 60 pips overnight after breaking above Friday’s high. However, the selloff lacked consecutive big bear bars. It is therefore probably just a bear leg in the 3 day, 100 pip tall tight trading range.
A tight range means that the chart is in breakout mode. The result can be a strong breakout up or down. Therefore, there is an increased chance of a quick selloff to below the January 18 major higher low. It is less than 100 pips below. But, since the daily chart is forming a trading range, the bear breakout is likely to reverse up.
The odds are against a strong bull trend today because of the 7 day bear micro channel. Most likely, the trading range trading of the past 3 days will continue. Furthermore, the 7 day selloff will probably fall below the January 18 low before there is a swing up for a couple of weeks.
Summary of today’s S&P Emini futures price action and what to expect tomorrow
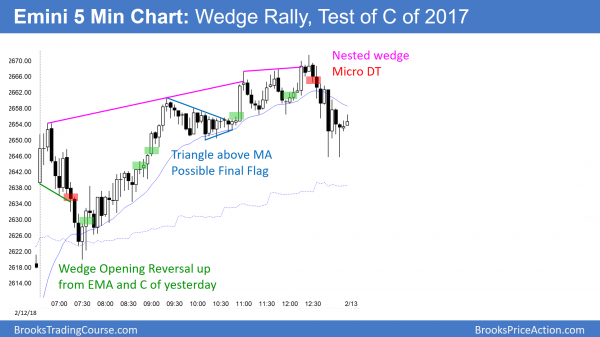
The Emini closed the small gap up and then rallied from a wedge opening reversal at the moving average. The rally was weak and today was a trading range day.
The Emini Triggered a High 2 buy signal on the daily chart today. Friday’s buy signal bar had a small body and therefore was somewhat weak. Today was not a strong entry bar. Yet, the odds are that the Emini will work up to last Wednesday’s high this week.
The bears see today as a pullback in a bear trend. They therefore will sell tomorrow below today’s low. But, last week had 2 strong reversals up. Moreover, the monthly chart is in a strong bull trend. Consequently, there are probably more buyers than sellers below today’s low.
See the weekly update for a discussion of the price action on the weekly candlestick chart and for what to expect going into next week.
Traders can see the end of the day bar-by-bar price action report by signing up for free at BrooksPriceAction.com. I talk about the detailed S&P Emini futures price action real-time throughout the day in the BrooksPriceAction.com trading room. We offer a 2 day free trial.
When I mention time, it is USA Pacific Standard Time (the Emini day session opens at 6:30 am PST, and closes at 1:15 pm PST). You can read background information on the intraday market reports on the Intraday Market Update page.


Hi, Al. When you scalp on 1 min chart, how far do you place your protective stops from entry price?
It depends on what I am doing. For example, if I think there is a strong bull breakout, I put my initial stop below the bottom of the rally. It might be 5 – 10 points below. I never plan to let it get hit. If I sell a bear wedge top reversal with a strong sell signal bar at resistance, I will usually put the stop above the bar. If I buy the close of a strong bull bar, but the next bar is a bear bar closing on its low, I often get out below the bear bar.
Dear Al, thank you.
Hi Al,
On the 1-minute chart today, there was a 6-tick gap between bar 12 close and bar 13 open. Do you think this is just an error in market data or is there any logical explanation behind this? The volume was over 5000 contracts on each bar, so liquidity is obviously very good as always. Also, if traders were so eager to buy (i don’t think so), i find it odd that the market started a swing down on bar 14.
Screenshot: https://i.imgur.com/M74GP9e.jpg
Most brokers have sampled data. You can always confirm by going to the CME site and pulling up their chart:
http://www.cmegroup.com/trading/equity-index/us-index/e-mini-sandp500.html
I do not see the gap there.