Trading Update: Wednesday February 2, 2022
Emini pre-open market analysis
Emini daily chart
- The Emini reversed up strongly last week from below the October low, which was the bottom of the 6-month trading range. But the V-bottom rally might stall soon.
- The January selloff was also a test of the 200-day MA and the bottom of a bull channel on the weekly chart. The bottom of the channel is a line that is parallel to the top of the channel and then attached at the March 3, 2020 pandemic low.
- Last week, I said that there would be a rally lasting at least a couple weeks and going above the December 3 low. That was the most important breakout point on the way down. When the market is in a trading range, there is usually a pullback beyond breakout points.
- Traders are deciding if the rally will continue up to a new high without more than a 3-day pullback (V-bottom, like December 2018 and the pandemic bottoms), or if there will be a 2nd leg down.
- The rally is strong enough to continue up in a V-bottom reversal.
- However, there are 2 problems with this. First, the Emini is still in a trading range, and most legs up and down disappoint traders expecting a trend. Most strong legs reverse.
- Next, the January selloff was unusually strong. That makes at least a small second leg sideways or down likely.
- However, if there are several more big bull days over the next couple of weeks, the odds will favor a V-bottom reversal up to a new high.
- Remember, I have been saying that the Emini should sell off early in 2022 and then rally to a new high later in the year. That is still true, but the new high could come within a couple months if the rally continues up.
- On the monthly chart, there are now consecutive OO patterns in a bull trend. Also, January closed below its midpoint. These factors increase the chance of a 2nd leg sideways to down, possibly to the 20-month EMA and the 4,000 Big Round Number.
- With January closing in the middle of its huge range, there is an increased chance February will be an inside bar on the monthly chart. It might even have a bull body.
- Unless February is a big bull bar, traders should expect a 2nd leg sideways to down, like in the 2018 October to December pullback.
- What about a crash? Crashes are rare so don’t worry about them.
- The best the bears will probably get is a test below the 4,000 Big Round Number this year. That would be about a 20% correction.
- They currently have a 50% chance, but the odds will drop quickly if the rally continues up for another week or two.
- 3 consecutive bull bars is becoming extreme. Also, the Emini is back to the 20-day EMA and a 50% retracement of the January collapse. These factors increase the chance of some profit taking and 2 to 3 days sideways to slightly down trading starting soon.
- The bears want a resumption of the bear trend.
- If Russia invades the Ukraine, there will probably be a 2nd leg down. But they won’t consider invading until late February, after the Winter Olympics. Otherwise, they will lose China’s political support.
- The concern over the invasion is an overhang that should prevent the rally going straight up to a new high during the Olympics.
- However, the reversal up is strong and there is no sign of it pausing. Traders are betting on at least slightly higher prices.
- Since there are now 3 consecutive bull days and the daily chart is still in a trading range, there will probably be a 2- or 3-day pause or pullback soon. The Emini might even go sideways until after the Olympics. At the moment, odds favor at least a little higher.
Emini 5-minute chart and what to expect today
- Emini is up 28 points in the overnight Globex session.
- Today is the 4th day in the bull trend reversal. Traders have been buying aggressively and they might buy more again today.
- However, the daily chart is still in a trading range, and a 4th big bull day would be fairly climactic. The bulls will probably take profits within a few days. That should result in a few sideways to down days.
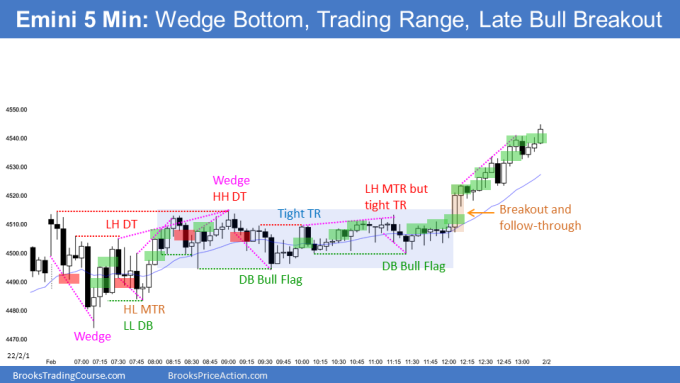
- Yesterday was in a tight trading range for most of the day. It came 3 days into a rally, which is late. It therefore might be the Final Bull Flag, and it is therefore a magnet below.
Yesterday’s Emini setups

Here are several reasonable stop entry setups from yesterday. I show each buy entry with a green rectangle and each sell entry with a red rectangle. Buyers of both the Brooks Trading Course and Encyclopedia of Chart Patterns have access to a much more detailed explanation of the swing trades for each day (see Online Course/BTC Daily Setups).
My goal with these charts is to present an Always In perspective. If a trader was trying to be Always In or nearly Always In a position all day, and he was not currently in the market, these entries would be logical times for him to enter. These therefore are swing entries.
It is important to understand that most swing setups do not lead to swing trades. As soon as traders are disappointed, many exit. Those who exit prefer to get out with a small profit (scalp), but often have to exit with a small loss.
If the risk is too big for your account, you should wait for trades with less risk or trade an alternative market like the Micro Emini.
EURUSD Forex market trading strategies
EURUSD Forex daily chart

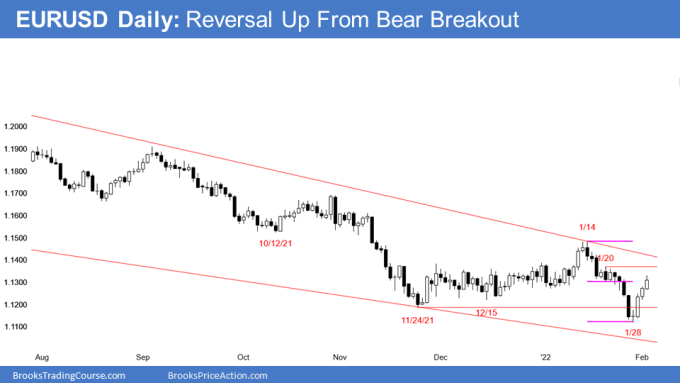
- The EURUSD Forex market reversed up from below its 9-week tight trading range after failing to breakout above it in mid-January.
- Today so far is the third consecutive bull day and the EURUSD is just above a 50% retracement of the last leg down.
- The next magnet for the bulls is the January 20 lower high, which was the start of the parabolic collapse at the end of the month.
- Yesterday was a bull day after Monday’s big reversal up. That follow-through increases the chance of at least a small 2nd leg sideways to up.
- The bears are hoping the this week’s bounce will form another lower high in the yearlong bear channel.
- The bulls want the reversal up to be the start of a bull trend lasting several months.
- But they will need many more bull trend bars and a strong break above the January 14 lower high before traders will believe that a significant bottom is in. Until then traders will continue to bet on new lows.
- Part of the reason behind the selloff from the January 14 lower high is the fear that Russia will invade the Ukraine. But as I wrote above, Russia will not consider invading until after the Olympics, which means late February.
- This takes pressure off for a couple weeks, which should slow the selling, or result in a return to the middle of the 9-month trading range.
- Since there is still uncertainty about the invasion, the EURUSD will probably be mostly sideways for a few weeks.
- The yearlong selloff on the monthly chart has not been as strong as the 2020 rally. It is more likely a pullback from that rally and not a resumption of the 14-year bear trend. Therefore, the bulls should get a rally lasting several months starting within a few months.
- Is this the start? The bulls need a strong breakout above a major lower high, like the January 14 high, before traders will conclude that the daily chart has begun a bull trend.
- At the moment, the bear trend has paused for several months. It has not yet clearly ended.
Summary of today’s S&P Emini futures price action and what to expect tomorrow

End of day summary
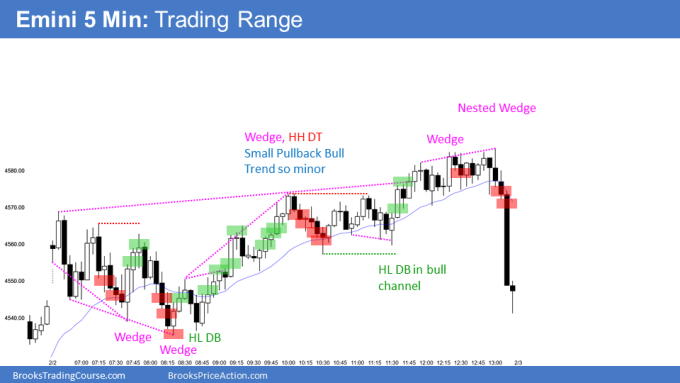
- After a gap up, the Emini sold off for a couple hours back down to yesterday’s close.
- It then rallied from a wedge bottom in a Small Pullback Bull Trend to above the January 10 low.
- It reversed down sharply into the close to below the open of the day.
- Today was a bear bar in a buy climax on the daily chart. That increases the chance for a pullback over the next few days.
- However, bulls will buy the pullback for at least a small 2nd leg up after this week’s strong rally.
See the weekly update for a discussion of the price action on the weekly chart and for what to expect going into next week.
Trading Room
Traders can see the end of the day bar-by-bar price action report by signing up for free at BrooksPriceAction.com. I talk about the detailed S&P Emini futures price action real-time throughout the day in the BrooksPriceAction.com on trading room days. We offer a 2 day free trial.
Charts use Pacific Time
When I mention time, it is USA Pacific Time. The Emini day session charts begin at 6:30 am PT and end at 1:15 pm PT which is 15 minutes after the NYSE closes. You can read background information on the market reports on the Market Update page.
Dr. Brooks,
Based on your prior experience could you advise on what may cause such a huge bear bar at the end? It seems too big for profit taking at end of the day for day traders. Is it news or earnings that market is digesting and reacting to?
Thanks!
It is purely technical. As I wrote before the open, the Emini is likely to pull back for a few days soon.
The bulls who bought before the close were disappointed by the absence of a strong trend at the end, and they exited, expecting a pullback for 1 to 3 days.
Also, all day in the chat room, I said the Emini was in a trading range day and it might get back to the open at the end of the day because that is what it often does, especially when the daily chart is in a buy climax at resistance.
Thank you Dr. Brooks!