Emini and Forex Trading Update:
Monday July 13, 2020
I will update again at the end of the day.
Pre-Open market analysis
Friday broke above Thursday’s high and the week closed on its high. This is the 1st time that the bulls have had consecutive bull bars on the weekly chart in 5 weeks. Traders expect at least slightly higher prices this week.
The bears want a double top with the June 5 high. If they get a reversal down this week, there would be a wedge rally with the June 19 and July 6 highs.
Many double tops have a wedge rally for the 2nd leg up. But the bears will need a reversal down for a sell signal. The odds favor the bulls. June was a bull flag and the Emini is now breaking above that flag.
The importance of the gap above the February 24 high
For the past several months, I have been talking about the gap above the February 24 high on the weekly chart. For the past month, the Emini tried to reverse down from below the gap several times and failed.
Big weekly gaps are rare. That makes the gap an unusually important magnet. Once a market gets close to a strong magnet, it usually has to reach the target before traders will consider selling aggressively.
Consequently, traders should expect a move to above the 3238.25 February 24 high within a week or two. At that point, traders will then decide if the Emini will reverse down or continue up to a new high.
Possible island bottom on weekly chart
Last week gapped up, but the gap was small and it quickly closed. Because this week closed on its high, there is an increased chance of a gap up this week as well. This is especially true with the strong magnet of the February 24 high just slightly above.
If there is a gap up, there will be a 4 month island bottom on the weekly chart. While island tops and bottoms are minor patterns, they are still signs of strength. The bulls will try to keep the gap open so that more traders will buy, expecting a new all-time high.
What happens if today does not gap up? Traders still expect a test into that February gap. Therefore, the odds favor higher prices over the next couple weeks, whether or not today sells off.
When a market gets nears an important magnet, it often accelerates toward the magnet. Why would a bear sell now when he believes he will be able to sell higher at the magnet soon? That shortage of sellers can create a buy vacuum up to resistance.
Overnight Emini Globex trading
The Emini is up 20 points in the Globex session. This week will probably open above last week’s high. There will then be a 4 month island bottom on the weekly chart.
Since this is the 2nd consecutive attempt to create an island bottom on the weekly chart, there is a higher probability of success. With the gap only being about half of the average recent daily range and with it likely to remain open today, traders should expect either a bull trend or trading range day today.
Is Friday’s buy climax a problem for the bulls today? Usually, the day after a buy climax day enters a trading range for at least a couple hours, starting by the end of the 2nd hour.
While that could happen today, there might be enough euphoria about the break above the July high to create another bull trend day today. Day traders should look for a bullish bias today, and possibly a reasonably strong bull trend day.
However, if the gap closes again like it did last Monday, day traders will expect a bear trend day.
Friday’s setups

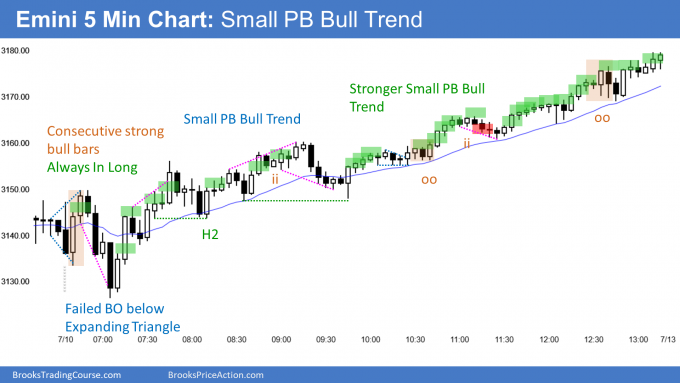
Here are several reasonable stop entry setups from Friday. I show each buy entry with a green rectangle and each sell entry with a red rectangle. I rarely also show limit order entries and entries on the close of bars. I do not want the lines to be distracting. If they are longer, I make them dotted. But, they have to be visible, so I make the shorter ones solid. Buyers of the Brooks Trading Course and Encyclopedia of Chart Patterns have access to a much more detailed explanation of the swing trades for each day (see Online Course/BTC Daily Setups).
My goal with these charts is to present an Always In perspective. If a trader was trying to be Always In or nearly Always In a position all day, and he was not currently in the market, these entries would be logical times for him to enter.
If the risk is too big for your account, you should wait for trades with less risk or trade an alternative market like the Micro Emini.
EURUSD Forex market trading strategies

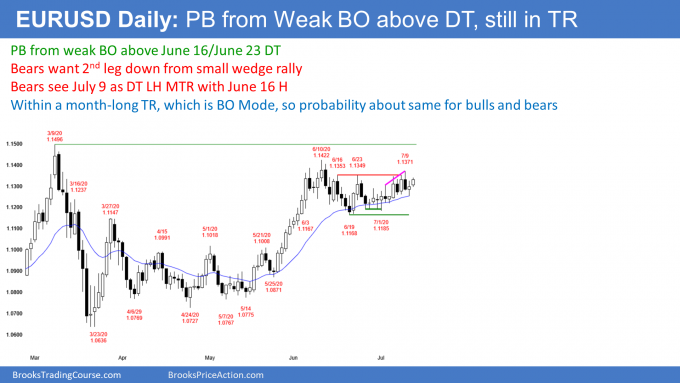
The EURUSD Forex market on the daily chart has rallied in a weak Small Pullback Bull Trend for 2 weeks. The bulls see Friday as just another small pullback, this time from a break above the June 16/June 23 double top. It is a High 1 buy signal bar, and the buy signal triggered today when today went above Friday’s high
However, the bears see Friday as a fail breakout above a 3 week range. It is their sell signal bar for a lower high major trend reversal.
Both the buy setup and the sell setup are credible. That means that the chart is in a trading range, which it obviously is, and that it is still in Breakout Mode. The probability alternates a little in favor of the bulls and the bears, but is stays very close to 50% for both. Until there is a breakout, there is no breakout. Traders will continue to look for minor reversals every 2 – 3 days.
Overnight EURUSD Forex trading
The 5 minute chart of the EURUSD Forex market broke a little above Friday’s high, but has stalled. If today closes far above Friday’s high and on the high of the day, traders will expect a breakout above last week’s high. They then would expect a test of the June 10 high and the March 9 high within a couple weeks. The bigger today’s bull body and the more the day closes on its high, the more likely the bull trend will test the March high.
The bears always want the opposite. At a minimum, they want today to close below Friday’s high. They would prefer for today to close on the low. It would then be a reasonable sell signal bar for a 2nd reversal down from the June 16/June 23 double top.
Overnight expanding triangle
Because the overnight range has been small, day traders have been scalping. Today broke above Friday’s low overnight, but then sold off to below the session low. It is now back above Friday’s high.
This is bullish and day traders are more willing to buy pullback than to sell rallies. But unless today breaks far above Friday’s high, day traders will still be willing to sell reversals down for a scalp.
Since today reversed up from a new low, it will probably not trade back down to the low. That reduces the chance of a big bear day.
However, because of the reversals overnight, there is now an expanding triangle on the 5 minute chart. That is a potentially credible sell setup, but the bears need a strong reversal down. So far they are not getting it. Today will probably remain a small, scalping day. If there is a trend, up is more likely than down.
Summary of today’s S&P Emini futures price action and what to expect tomorrow

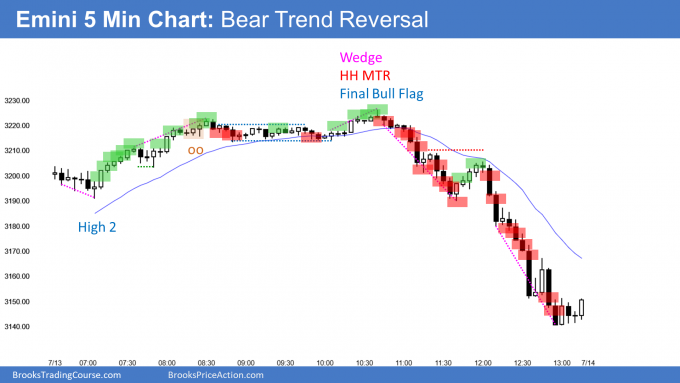
Here are several reasonable stop entry setups for today. I show each buy entry with a green rectangle and each sell entry with a red rectangle. I rarely also show limit order entries and entries on the close of bars. I do not want the lines to be distracting. If they are longer, I make them dotted. But, they have to be visible, so I make the shorter ones solid. Buyers of the Brooks Trading Course and Encyclopedia of Chart Patterns have access to a much more detailed explanation of the swing trades for each day (see Online Course/BTC Daily Setups).
My goal with these charts is to present an Always In perspective. If a trader was trying to be Always In or nearly Always In a position all day, and he was not currently in the market, these entries would be logical times for him to enter.
If the risk is too big for your account, you should wait for trades with less risk or trade an alternative market like the Micro Emini.
End of day summary
By gapping up today, the Emini created a 4 month island bottom on the weekly chart. It rallied above the June high and above the close of 2019.
However, it reversed down from a Final Bull Flag and made a new low. This is the 2nd consecutive Monday when the bulls created an island bottom on the weekly chart, but could not keep the gap open. Furthermore, the month-long rally is a wedge and a double top with the June high.
Today is a credible sell setup for a swing down to the middle of the 4 month trading range. Most reversal attempts are minor. Therefore the probability is not particularly high. However, this is a good sell setup for the bears hoping for a move down to below 2700 over the next month.
The odds are now against a move up to the February gap before a reversal down. The math can change on any day, but the bears now have an edge.
See the weekly update for a discussion of the price action on the weekly chart and for what to expect going into next week.
Trading Room
Traders can see the end of the day bar-by-bar price action report by signing up for free at BrooksPriceAction.com. I talk about the detailed S&P Emini futures price action real-time throughout the day in the BrooksPriceAction.com trading room. We offer a 2 day free trial.
Charts use Pacific Standard Time
When I mention time, it is USA Pacific Standard Time (the Emini day session opens at 6:30 am PST, and closes at 1:15 pm PST). You can read background information on the intraday market reports on the Market Update page.
I second the proposal for a forum to discuss daily charts/trades/signal bars, etc.
Al,
I passed on the b7 B (H2) because of the poor SB.
Do you think it’s generally ok to take setups with poor SB because it’s early in the session as long as the pattern plays out in a reasonably good trade location and good context (gap up, W, H2)?
I thought it was a bit far from the EMA as well so I passed and trapped myself out for a few bars before finally B above b10.
When is it ok to be more liberal with SB quality in your opinion?
Thanks!
Hi Josh,
As noted above Al does not have time to answer trading questions here. So let me give my answer.
You stated that context for buy was actually quite good (gap up, wedge, H2) so not really a case of being liberal. It was a low probability trade (possible swing) with a reasonable low risk, so Ok to take if your account can support the risk (5+ pts).
Yes, the SB was poor so if that bothers you, no problem to skip setup and wait for next one, which is what you did. So all good. swell done on getting in.
I would not suggest it is “…generally ok to take setups with poor SB early in session”, as so many big traders piling in at that time adjusting their positions, so more uncertainty – reflected here in the TR doji bars on the way down. Others may feel/trade different.
I wonder if we ought to create a forum for discussions on daily charts? Comments here get buried below new posts here within a week or so.
Thank you for your insights Richard. I, for one, would be an advocate for a forum to discuss the Daily Recaps.
The time to take bad SBs is when the market is in a strong trend and you are trading with trend pullbacks. You can see this looking at some of the sells Al has marked in the afternoon under dojis and even bull bars.