Emini 50% retracement of last week’s bear trend
I will update again at the end of the day.
Pre-Open market analysis
The Emini formed a trading range yesterday after Tuesday’s rally. That rally topped out at a 50% retracement of the 2 week selloff. After yesterday’s lack of follow-through buying, the bulls need a bull day today.
Their problem is the bull trend line on the daily chart. It is around Tuesday’s low and the Emini still might get there this week by going sideways or down. Consequently, to make traders believe that Tuesday was an adequate test of that support, the bulls need a strong rally today.
Overnight Emini Globex trading
Today is rollover day in the Emini. Most traders will continue to trade the September contract today because it will have much greater volume. However, the continuation charts are now based on December.
The Emini is up 10 points in the Globex market. It therefore might gap above yesterday’s high. The bulls need a strong rally today and tomorrow to confirm Tuesday’s micro double bottom on the daily chart. If they get it, the odds will favor a new high within a couple of weeks. If they do not, the Emini will likely continue sideways to down to the bull trend line below.
The Emini has been in a tight range for 6 days. That increases the chance of a lot of trading range trading again today. But, since the Emini is at support on the daily chart, it is in breakout mode. Tuesday was a small bull breakout. There is an increased chance of a bull trend day today and a confirmation of Tuesday’s bull trend reversal.
Yesterday’s setups
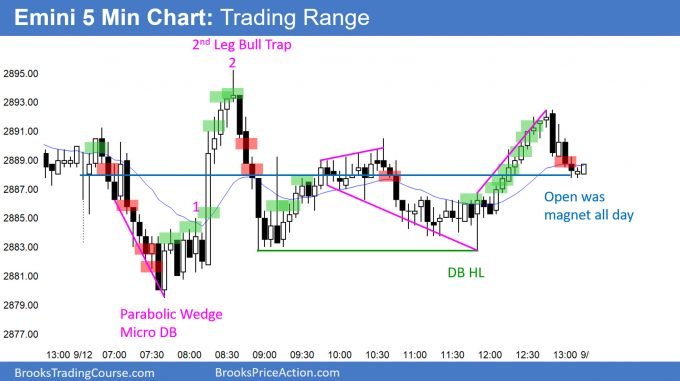
Here are several reasonable stop entry setups from yesterday. I sometimes also show limit order entries and entries on the close of bars. My goal with these charts is to present an Always In perspective. If a trader was trying to be Always In or nearly Always In a position all day, and he was not in a position at the moment, these entries would be logical times for him to enter.
EURUSD Forex market trading strategies
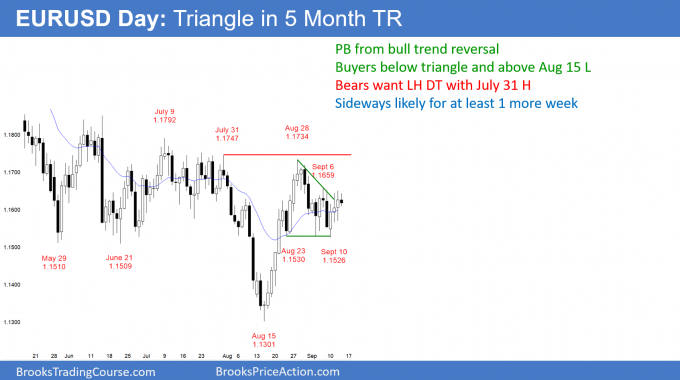
The EURUSD daily Forex chart has been sideways for 3 weeks after its bull trend reversal. This might continue for 1 – 2 months, but the odds favor a bull breakout. If there is a break below the September 10 low, there will be buyers above the August 15 low.
The EURUSD daily Forex chart has been in a trading range for 5 months. Despite the August 28 lower high, it is also in the early stages of a bull trend. Therefore, the odds are that it will break above the 1.1850 top of the range before it falls below the August 15 1.13 bottom of the range. But, there is no sign of an impending breakout, so the range could continue for a month or more.
It had been in a tight triangle for 3 weeks. Traders ave been taking profits after 1 – 3 days and betting on small reversals.
Overnight EURUSD Forex trading
The EURUSD 5 minute Forex chart has been in a 30 pip range overnight. Day traders are continuing to scalp, betting on reversals instead of breakouts.
Since the past 3 weeks have been in a triangle, the odds of a bear breakout below the 3 week tight range are almost as high as for a breakout above. However, the bear breakout will fail, even if it lasts a few days. The bulls should be able to create a higher low above the August 15 low.
The 5 minute chart had a 40 pip rally over the past 10 minutes. That increases the chance of a bull trend day today.
Summary of today’s S&P Emini futures price action and what to expect tomorrow
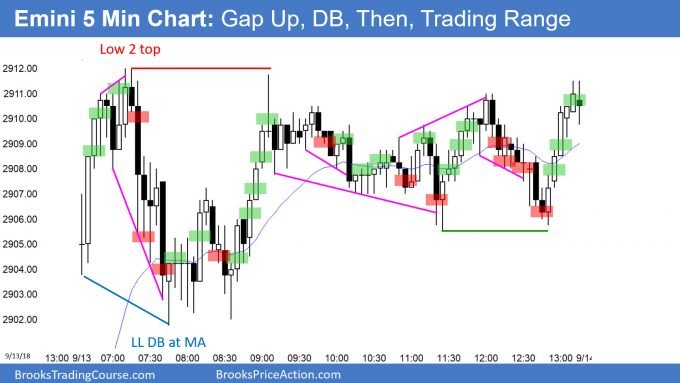
Here are several reasonable stop entry setups for today. I sometimes also show limit order entries and entries on the close of bars. My goal with these charts is to present an Always In perspective. If a trader was trying to be Always In or nearly Always In a position all day, and he was not in a position at the moment, these entries would be logical times for him to enter.
The Emini gapped up, but then went sideways. The bulls need strong follow-through buying tomorrow. If they fail to get it, this 4 day rally might reverse down from a lower high. If tomorrow gaps down, today will be a 1 day island top. However, island tops and bottoms are minor reversals.
Tomorrow is Friday and therefore weekly support and resistance are important, especially at the end of the day. This week’s high, low and open are magnets, as are last week’s high and low.
See the weekly update for a discussion of the price action on the weekly candlestick chart and for what to expect going into next week.
Traders can see the end of the day bar-by-bar price action report by signing up for free at BrooksPriceAction.com. I talk about the detailed S&P Emini futures price action real-time throughout the day in the BrooksPriceAction.com trading room. We offer a 2 day free trial.
When I mention time, it is USA Pacific Standard Time (the Emini day session opens at 6:30 am PST, and closes at 1:15 pm PST). You can read background information on the intraday market reports on the Intraday Market Update page.


Hi Al, can you explain why #2 is reasonable buy? I was looking for at least two reasons (as suggested in your book) and I don’t see other reasons to buy except that #2 is a big bull bar closing its high (or is this one reason good enough?).
Also why it is a reasonable sell below #12? It is 1) a doji with long tail, 2) at MA, 3) around low of #1 and #2, I thought there might be more buyers than sellers below #12?
Can you also explain why it is reasonable buy above #28? I find myself always scared when buying in middle of a potential TR, and I was also scared that #29 could be a bear reversal bar and form a double top bear flag with #21, also as of #28, bulls have not yet managed to have consecutive 3 bull bars in the last 20 bars or so.
Sorry for too many questions!
Hi Coria,
I answered you the other day and asked kindly to please not post complicated questions for Al here. Al really does not have the time to get into such detail here. Other traders can drop in and comment I am sure. This is not a forum and comments here should really be clarifications for above content if directed to Al, not in-depth analysis.
If you want the in-depth analysis on Al’s charts could I suggest you join his trading room where these questions would have certainly been discussed in real time.
Sorry for the reminder but hope you understand.
Hi Richard, I think I am confused.. I think you said “Al’s goal in answering comments is to clarify something that he did not make clear”, and my questions was about the entries that Al highlighted on the chart, some of the entry don’t look clear to me, that is why I am asking here… (And I know it is impossible for Al to explain every entry on the chart too)
I am in the trading room for a long time and I did ask questions every now and then, but for the trades that Al put AFTER the day session on the delay post, how is it possible to ask in real time?
I don’t mind using any other channel to ask questions as long as there is a way. Feel free to point out and Thank you!
Sorry I think I misread part of your response, for the trades in questions I mentioned in my post, I DID watch the downloaded video for today BEFORE I post, but I didn’t see Al talked about the reasons, for e.g. my first question, if you watch the video, after #2, Al “we only have one bull bar, doji on bar 1, so while always in long, it could rally in the first 1 hour, i didn’t buy above 2….”. This is confusing when I see Al highlighted it as an entry on the post. (Please understand I am not trying to be picky, I simply want to find out what I am missing in reading the chart if Al says it is a reasonable trade)
Since the market is always in long in a bull spike, it is ok to buy for any reason even at the highest point if your stop is at the bottom of the spike. That makes it a valid entry at the time.
I think short below bear bars and buy above bull bars are all reasonable. even if you short below the L of 58, with a proper stop loss, which should be the H of this day, also the H of this tight trading range, you are ok to get out at least break even later or even scale in and add short position at L of 68 and get out with some profit. A reasonable entry does not mean it’s perfect, or proper for everyone since we all have different position management skills, attitudes, feelings and so on. If you feel confused, maybe better to wait or use a lighter position to get involved, cause Al also said trade with positions that “I do not care” size. If one ES contract still gets you panic during trading, maybe try trade SPY for better alignment with the market and your very personal best at this stage. Things will get better when your feeling of the market gets better.