Trading Update: Friday October 15, 2021
Emini pre-open market analysis
Emini daily chart
- There are 2 things that traders are watching most closely. The first is the 50-day moving average (MA). The Emini is now above 50-day MA.
- Next is the trading range that began with the September 20 low.
- I have been saying for several weeks that the Emini would probably form a trading range between the 50-day MA and the 100-day MA.
- Also, I said the trading range would likely have a double top around the 50-day MA and a double bottom around the 100-day.
- There is a double bottom at the 100-day MA.
- If the Emini stalls here for a few days and then turns down, there would be a double top at the 50-day MA.
- As long as the Emini is in the trading range, it is in Breakout Mode. That means there is a 50% chance of a successful bull breakout and a 50% chance of a successful bear breakout.
- When last Thursday, October 7, turned down from just below the 50-day MA, I said that traders would not consider that to be an adequate test. They wanted the rally to get above the average before turning down.
- For the past week, I said that the Emini would rally to at least a little above the 50-day MA within a couple weeks. It closed above it yesterday, and yesterday closed on its high. The Emini should trade at least a little higher today.
- Traders do not yet know if yesterday’s rally was a buy vacuum test of resistance or a resumption of the 18-month bull trend.
- The bulls want a close far above the 50-day MA within the next week. It would then become support.
- The bears want a reversal down and a close far below the 50-day MA.
- Since yesterday went above the moving average, traders would see a strong reversal down at some point next week as a sign that the 50-day MA has become reliable resistance. It would increase the chance of lower prices.
- If the rally reaches the all-time high and then turns down, there would be a bigger double top.
- As for the trading range, the bulls want a measured move up above that October 7 high, which is the neckline of the September 20/October 4 double bottom. That would result in a new all-time high.
- While yesterday’s rally was strong, the bulls need follow-through buying over the next week. That would make a test of the all-time high likely.
Emini weekly and monthly charts
- On the weekly chart, this week went above last week’s high. But there is a 6-bar bear micro channel. That is a weak buy setup. There probably will be a lower high or a double top with the all-time high within a month and then a 2nd leg sideways to down, like last year at this time.
- Although the Emini broke below the weekly bull channel in September, the Small Pullback Bull Trend is still intact. It will end once there is a pullback that is at least 50% bigger than the biggest prior pullback in the trend. That pullback was in September and October last year.
- Unless next week is a big bull bar on the weekly chart, there will still be a 50% chance that September 2 will be the start of that pullback.
- On the monthly chart, September was a big outside down bar. It was the third time that there was a bear bar in the rally from the pandemic crash.
- Look at all prior buy climaxes over the past decade. Most of the time, once there was a bear bar, there was another bear bar within a month or two. That should therefore happen this time.
- Therefore, if there is a new high, it probably will only last a bar or two (a month or two). Traders should expect a 2nd bear bar on the monthly chart before the end of the year.
- October so far is a bull bar closing near its high. If the month remains like this, it will be a High 1 buy signal bar for November. November then would probably trade above the October high.
- September was an outside down bar. Traders should understand that the month after an outside down bar rarely is an outside up bar. That would create an OO (outside-outside) Breakout Mode Pattern. While unlikely, October could rally strongly to above the September high before the end of the month.
- There is still a 50% chance that either November or December will be a 2nd bear bar.
Emini 5-minute chart and what to expect today
- Emini is up 18 points in the overnight Globex session. It will gap above yesterday’s high.
- Yesterday was a buy climax day, even though the Emini was in a trading range around the 50-day MA for the final 4 hours.
- The day after a buy climax day has a 75% chance of being sideways to down for at least 2 hours, beginning by the end of the 2nd hour.
- Even with a couple hours of sideways to down trading, the bulls will try to create a follow-through bull trend day today. The rally would probably be a weaker type of trend, like a bull channel or a trending trading range day.
- There might be a pullback down to the 50-day MA, but today will probably not be a big bear day after yesterday’s surprisingly strong rally to the start of a resistance zone.
- Today is Friday so weekly support and resistance can be important, especially in the final hour. Last week’s high is a magnet below, and it is near the daily magnet of the 50-day MA. There are no other nearby major weekly targets.
Yesterday’s Emini setups

Here are several reasonable stop entry setups from yesterday. I show each buy entry with a green rectangle and each sell entry with a red rectangle. Buyers of both the Brooks Trading Course and Encyclopedia of Chart Patterns have access to a much more detailed explanation of the swing trades for each day (see Online Course/BTC Daily Setups).
My goal with these charts is to present an Always In perspective. If a trader was trying to be Always In or nearly Always In a position all day, and he was not currently in the market, these entries would be logical times for him to enter. These therefore are swing entries.
It is important to understand that most swing setups do not lead to swing trades. As soon as traders are disappointed, many exit. Those who exit prefer to get out with a small profit (scalp), but often have to exit with a small loss.
If the risk is too big for your account, you should wait for trades with less risk or trade an alternative market like the Micro Emini.
EURUSD Forex market trading strategies
EURUSD Forex daily chart

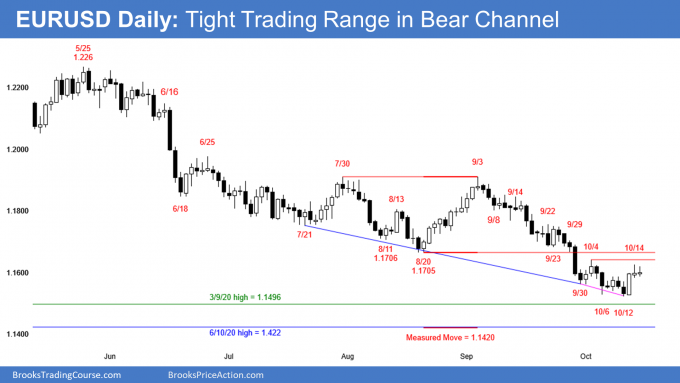
- Yesterday was a doji bar with a big tail on top. So far, today is a 2nd consecutive doji, forming a potential micro double top.
- The bears hope it is the 2nd high in a double top with the October 4 high.
- They want a reversal down to below the October 12 neckline, and then a measured move down.
- The bulls hope yesterday was a pullback from Wednesday’s strong reversal up from a micro wedge bottom. They want a reversal up from below yesterday’s low and then a bull trend.
- The EURUSD has been in a tight trading range for 2 weeks. Traders are deciding if it will reach targets below before reversing up, or if the reversal up began this week.
- The odds still favor a dip below the March 9, 2020 high within the next few weeks. This is true even if the EURUSD rallies a little higher. That high was the breakout point for last year’s strong rally, and the EURUSD has been in a trading range for 6 years. In a trading range, when a pullback gets near support or resistance, it usually goes through it before reversing.
- Whether or not the EURUSD dips below the March 9, 2020 high or the June 10, 2020 high (a less important breakout point), it should rally to above the August 20 low. That is the breakout point for the September selloff and therefore a magnet above.
- Consequently, traders should expect a rally for several weeks to at least above the August 20 low and maybe to the September 3 high (July 30/September 2 double top). However, it might 1st fall to 1.14, which is the June 10, 2020 high and the measured move down from the double top.
Summary of today’s S&P Emini futures price action and what to expect tomorrow

End of day summary
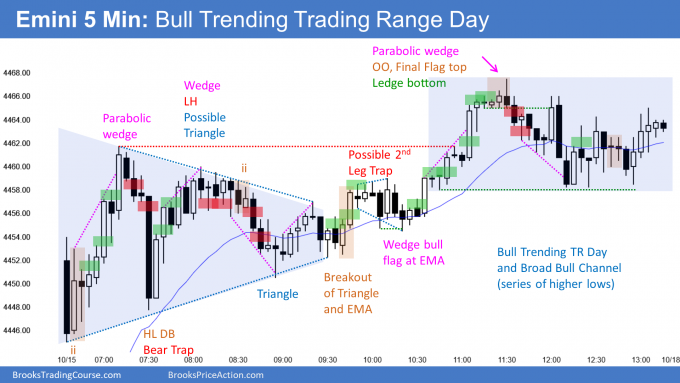
- After a gap up, the Emini entered a triangle for 3 hours.
- As I said early in the day, today would probably have a lot of trading range trading, and if there was a bull trend, today would likely be a Trending Trading Range day.
- Because the week closed near its high, there is an increased chance of higher prices next week. Next week might gap up on the weekly chart.
- The bears want a double top with either the September 23 lower high or the September 2 all-time high.
See the weekly update for a discussion of the price action on the weekly chart and for what to expect going into next week.
Trading Room
Traders can see the end of the day bar-by-bar price action report by signing up for free at BrooksPriceAction.com. I talk about the detailed S&P Emini futures price action real-time throughout the day in the BrooksPriceAction.com trading room. We offer a 2 day free trial.
Charts use Pacific Time
When I mention time, it is USA Pacific Time. The Emini day session charts begin at 6:30 am PT and end at 1:15 pm PT which is 15 minutes after the NYSE closes. You can read background information on the market reports on the Market Update page.


Hi, Al.
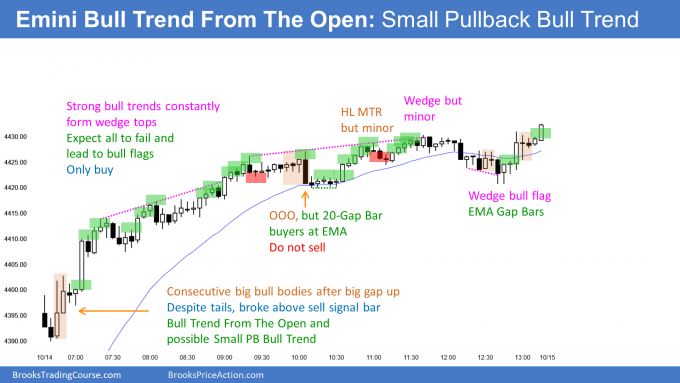
Both the October 5th, October 7th and yesterday (October 14th) were “bull trend from the open and small PB bull trend” days. On the October 5th, you considered consecutive wedges as a good sell signal, even though it was a small PB bull trend day. Then again at the end of the same day, you considered a good sell signal a wedge followed by a HH MTR. On the October 7th, you considered a parabolic wedge as good sell signal bar, even though it was also a bull trend from the open and possibly a small PB bull trend day. Despite all this, yesterday you didn’t consider a very reasonable wedge at 7:30 to 9:00 a good sell signal, and then again a minor wedge at almost the end of the day wasn’t considered a good sell signal, even though it was reasonable to think of it as a HH MTR. Although I understand the fact that strong bull trends constantly form wedge tops and I should expect all to fail, you haven’t expected all of them to fail on the prior days (October 5th and October 7th). I’m wondering if it a hindsight advantage is happening here for some reason. Would you be so kind to explain your line of thought?
Thanks, Al
I know it can be frustrating when the differences are small. Everyone wants things to be clear, but they rarely are. I would need hours to explain all that goes into this. When I am adding the red and green boxes, I take the Forrest Gump approach. I do not give it much thought, and I do not believe I am curve fitting.
The differences are small but real. Here is the Reader’s Digest answer (assuming you are my age and know what Reader’s Digest is!).
The more climactic a move is, especially if it is at important support or resistance, the more likely there will be exhausted traders and a reversal for at least a couple small legs. The more the day looks like it is not exhaustive, especially if there is room to important, reachable support or resistance, and especially if there are subtle gaps, which often lead to measured moves, the more likely any reversal will be a brief pullback.
Thank you for your answer, Al. Although I’d love to read or listen to your explanations for hours, I understand you don’t have the time nor need to do that. I appreciate all your effort and feedback and I had no idea what Reader’s Digest was before googling it =)