Emini and Forex Trading Update:
Tuesday December 29, 2020
I will update again at the end of the day.
Pre-Open market analysis
Yesterday gapped up to a new Emini all-time high. It triggered High 1 buy signals on the daily and weekly charts. Since yesterday was a bull day, there is an increased chance of higher prices today.
There are 3 trading days remaining in 2020. The year will probably close near its high, and possibly at the high. The bulls want 2021 to gap up on Monday to a new all-time high on the daily, weekly, monthly, and yearly charts. Whether or not it does, December so far is strong enough to make it likely that January will go at least a little higher.
The bears want a 100-point end-of-the year selloff. That would reduce the chances of higher prices in January. However, they only have 3 days left, and the Emini just triggered buy signals on the daily and weekly charts. It is more likely that the Emini will go sideways to up and try to close the year on the high.
But, markets often make big moves just before a bar closes. At the moment, the bears have only a 30% chance of a big selloff this week.
Overnight Emini Globex trading
The Emini is up 13 points in the Globex session. It will probably gap up to a new all-time high again today. Because the bulls have been strong, they will probably be able to prevent a big bear trend day today. But with this being the quietest week of the year, and yesterday being sideways for most of the day, there is an increased chance of mostly sideways trading again today.
There are only 3 trading days left to the month and year. When a bar is about to close, here on the monthly and yearly charts, and the bar is at the high, there is an increased chance of a selloff.
Most bull candlesticks have noticeable tails on top. They usually form just before the bar closes. For a tail to be noticeable on the monthly and yearly charts, the Emini would probably have to be at least 50 to 100 points down from the high. Therefore, there is an increased chance of a pullback ahead of Thursday’s close when the month and year end.
Yesterday’s setups

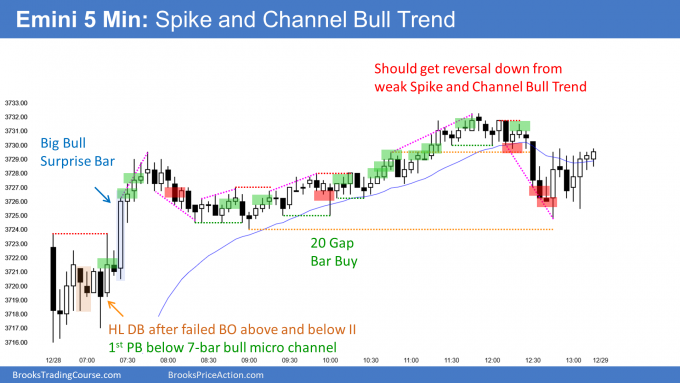
Here are several reasonable stop entry setups from yesterday. I show each buy entry with a green rectangle and each sell entry with a red rectangle. Buyers of both the Brooks Trading Course and Encyclopedia of Chart Patterns have access to a much more detailed explanation of the swing trades for each day (see Online Course/BTC Daily Setups).
My goal with these charts is to present an Always In perspective. If a trader was trying to be Always In or nearly Always In a position all day, and he was not currently in the market, these entries would be logical times for him to enter.
If the risk is too big for your account, you should wait for trades with less risk or trade an alternative market like the Micro Emini.
EURUSD Forex market trading strategies

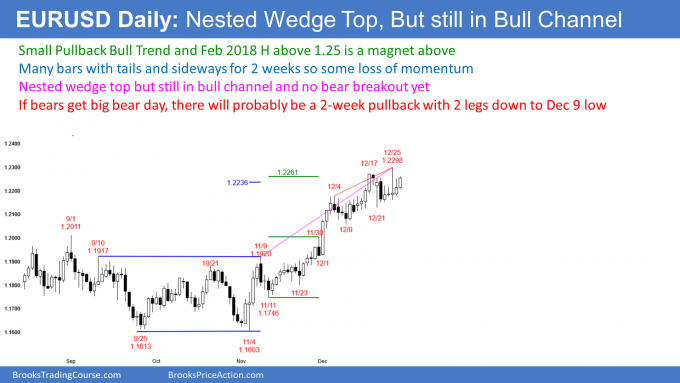
The EURUSD Forex market on the daily chart has been in a Small Pullback Bull Trend since the November low. It has also been in a tight trading range for 2 weeks, and Friday was a big reversal day. That means there is some loss of momentum.
Also, because there is a nested wedge bull channel, there is an increased risk of a selloff lasting 2 to 3 weeks. But until there is a clear top and a strong reversal down, traders will continue to buy. The next target for the bulls is the February 2018 high just above 1.25.
Yesterday was a bull inside day in a bull trend, and it is therefore a High 1 bull flag buy signal bar. But it had a big tail on top, like many of the bars for the past several weeks. That makes it a weak buy signal. It increases the chance of sellers above its high, and then a continuation of the 2 weeks of sideways trading.
It is important to remember that Forex markets have an increased chance of big moves at the start of a year. While the bears want a reversal down from the nested wedge, the bulls want a breakout above the bull channel and an acceleration up.
Overnight EURUSD Forex trading
The 5-minute chart of the EURUSD Forex market has been rallying overnight, but it has been mostly sideways for several hours. By going above yesterday’s high, it triggered a daily buy signal. But it is also at the top of a 2-week tight trading range. That reduces the chance of a strong trend up from here today.
Because the EURUSD has been trending up overnight, day traders have been buying. But with it mostly sideways for 5 hours, the bulls have been buying pullbacks and taking profits around the high.
The bears are always willing to sell when there is a trading range, but with the biggest pullback being only around 20 pips, it is easier to make money buying pullbacks than selling rallies.
With yesterday being a weak buy signal bar, at the top of a 2-week tight trading range on the daily chart, and today stalling just above yesterday’s high, there is an increased chance of a reversal down today.
Can the overnight rally accelerate up today? That is unlikely, given all the bear bars over the past several hours. Most likely, today will continue sideways, but there is an increased chance of a reversal down.
Summary of today’s S&P Emini futures price action and what to expect tomorrow

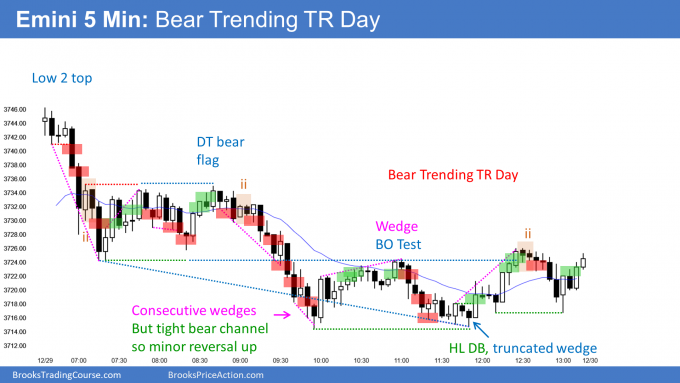
Here are several reasonable stop entry setups from yesterday. I show each buy entry with a green rectangle and each sell entry with a red rectangle. Buyers of both the Brooks Trading Course and Encyclopedia of Chart Patterns have access to a much more detailed explanation of the swing trades for each day (see Online Course/BTC Daily Setups).
My goal with these charts is to present an Always In perspective. If a trader was trying to be Always In or nearly Always In a position all day, and he was not currently in the market, these entries would be logical times for him to enter.
If the risk is too big for your account, you should wait for trades with less risk or trade an alternative market like the Micro Emini.
End of day summary
The Emini gapped up to a new all-time high, but reversed down from the top of the bull channel that began with the November 9 high. It fell below yesterday’s low, and today was therefore an outside down bar on the daily chart. Today was also a bear trending trading range day. There was a double bottom and a truncated wedge late in the day, but it resulted in only a minor reversal up.
As an outside down day at resistance in a bull trend, today is a sell signal bar for tomorrow. If tomorrow gaps down, there will be a 2-day island top, which would slightly improve the chances for the bears.
However, the Emini has been in a Small Pullback Bull Trend on the daily chart since November 10. Every reversal down led to a 1- or 2-day pullback and not the start of a bear trend.
But the bears have a better chance now because we are at the end of the year. Markets have an increased chance of a reversal just before any bar closes. Here, the monthly and yearly bars are about to close.
Remember the bears want the yearly and monthly charts to have a conspicuous tail on top of the current candle. They need the Emini to sell off 50 to 100 points by Thursday’s close.
The bulls want the year to close within 20 points of an all-time high. This would give them a chance of creating a gap up on Monday when 2021 begins.
This will be the fight during the final 2 trading days of 2021. Will 2020 stay up near the all-time high or will the Emini sell off 50 – 100 points by Thursday’s close?
See the weekly update for a discussion of the price action on the weekly chart and for what to expect going into next week.
Trading Room
Traders can see the end of the day bar-by-bar price action report by signing up for free at BrooksPriceAction.com. I talk about the detailed S&P Emini futures price action real-time throughout the day in the BrooksPriceAction.com trading room. We offer a 2 day free trial.
Charts use Pacific Standard Time
When I mention time, it is USA Pacific Standard Time (the Emini day session opens at 6:30 am PST, and closes at 1:15 pm PST). You can read background information on the intraday market reports on the Market Update page.