Emini and Forex Trading Update:
Thursday November 21, 2019
I will update again at the end of the day.
Pre-Open market analysis
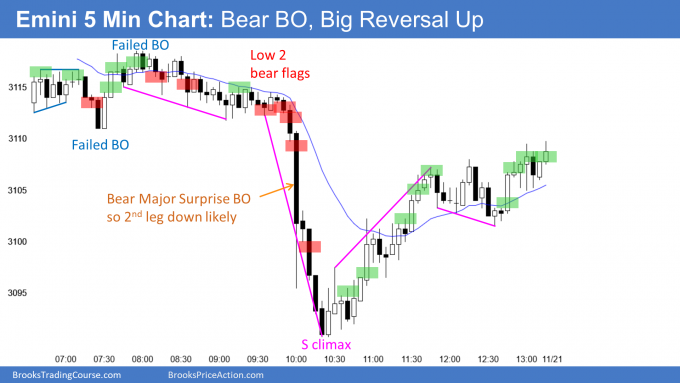
The Emini had a strong bear breakout midday yesterday. It triggered the parabolic wedge top sell signal on the daily chart by falling below Tuesday’s low. It also broke below the bull trend line at the bottom of the 6 week tight bull channel. Finally, it dipped back below the 3100 Big Round Number, which was resistance for several days last week.
However, it closed the day above the support and above the middle of the day’s range. It was a bear doji bar on the daily chart and not a strong bear day. Yesterday is now a weak buy signal bar on the daily chart for a High 1 bull flag.
Because it is weak buy setup in an overbought market, there will probably be sellers not too far above its high and above Tuesday’s all-time high. Furthermore, the open of the week will probably be a magnet through tomorrow’s close. Traders will expect this to limit both the upside and downside for today and tomorrow.
Has a 1 – 2 week pullback begun?
Yesterday is a good candidate for the start of the 1 – 2 week pullback that I thought would begin in November. The pullback so far has been 40 points. I have been saying that it would probably be 50 – 100 points. Also, it is likely to last more than a couple days. Consequently, traders should expect sideways to down trading over the next week. This is true even if there is one more new high 1st.
Will this be the 8% correction that some on TV are predicting? Probably not. After 6 bull bars on the weekly chart, the bears will likely need at least a micro double top on that chart before they can get more than a week or two of selling.
Overnight Emini Globex trading
The Emini is up 4 points in the Globex session. Yesterday’s strong selloff and then big reversal up created confusion. Confusion typically results in a trading range.
This is especially true with the Emini so close to several magnets. The open of the week is the most important. Traders expect a small bear body on the weekly chart this week after last week’s buy climax and 6 consecutive bull trend bars on the weekly chart. The other magnets are the 3100 Big Round Number, the EMA on the 60 minute chart, the bull trend line on the daily chart, and yesterday’s high.
Since trading range trading is likely today and tomorrow, day traders should expect at least one swing up and one swing down during both days. A strong trend is unlikely.
Yesterday’s setups

Here are several reasonable stop entry setups from yesterday. I show each buy entry with a green rectangle and each sell entry with a red rectangle. I rarely also show limit order entries and entries on the close of bars. Buyers of the Brooks Trading Course and Encyclopedia of Chart Patterns have access to a much more detailed explanation of the swing trades for each day.
My goal with these charts is to present an Always In perspective. If a trader was trying to be Always In or nearly Always In a position all day, and he was not currently in the market, these entries would be logical times for him to enter.
EURUSD Forex market trading strategies

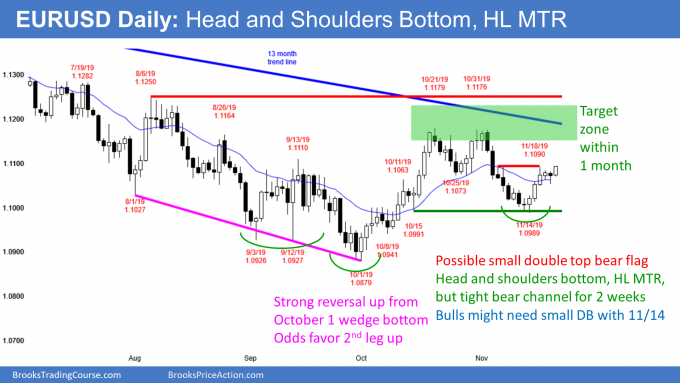
The daily chart of the EURUSD Forex market formed a higher low last week after a wedge bottom. Traders expect a 2nd leg sideways to up. The 2 week rally meets the minimum objective.
The bulls want a test of the October high and a major trend reversal into a bull trend. However, the bears want a lower high and a resumption of the 2 year bear trend.
While the weekly chart is in a bear channel, the daily chart has been in a trading range for 4 months. Trading ranges resist breaking out into trends. Consequently, both the bulls and bears will probably be disappointed by the next several weeks. There will probably be sellers near the 1.12 top of the range and buyers near the 1.09 bottom.
Since the October rally on the weekly chart was the strongest one in 2 years, there will probably be a test of the October high. But there might be a test of the October low first. Traders should expect limited downside over the next few weeks and a test of the 13 month bear trend line and the October double top. Both are around 1.12.
Overnight EURUSD Forex trading
The 5 minute chart of the EURUSD Forex market broke above yesterday’s high overnight. That triggered a High 1 bull flag buy signal on the daily chart.
Today is the entry bar. So far, it is a small bull trend bar on the daily chart. While this is good for the bulls, a bigger bar would be much better. The rally over the past 6 hours has only been 30 pips. This is not a strong bull trend. Day traders are not buying as the EURUSD is going up. They therefore are waiting for pullbacks. That makes a big bull trend day unlikely.
While the rally has been small, so have the pullbacks. The bears are not yet selling. If the 5 minute chart begins to go sideways for 5 – 10 bars, the bears will look to sell reversals down for 10 pip scalps.
Today will probably be a small trading range day. The bulls will continue to look for 10 – 20 pip pullbacks to buy for scalps and the bears will begin to scalp once the 5 minute chart begins to go sideways.
Summary of today’s S&P Emini futures price action and what to expect tomorrow

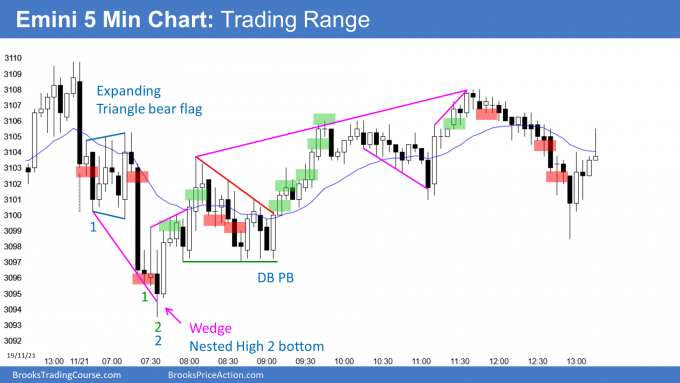
Here are several reasonable stop entry setups for today. I show each buy entry with a green rectangle and each sell entry with a red rectangle. I rarely also show limit order entries and entries on the close of bars. Buyers of the Brooks Trading Course and Encyclopedia of Chart Patterns have access to a much more detailed explanation of the swing trades for each day.
My goal with these charts is to present an Always In perspective. If a trader was trying to be Always In or nearly Always In a position all day, and he was not currently in the market, these entries would be logical times for him to enter.
End of day summary
Today sold off early and reversed up. It was a trading range day.
Since the open of the week, I have said that this week would probably form a bear bar on the weekly chart. That is still likely. But the bulls are trying to form a 7th consecutive bull bar on the weekly chart. They hope to get the week to close above the week’s open.
While they might get back to the open of the week tomorrow, they will probably fail to create a 7th bull bar. The best they probably will get is a big tail on the bottom of this week’s candle stick. Tomorrow will probably again have mostly trading range price action. The Emini might have begun a 2 week, 50 – 100 point pullback.
See the weekly update for a discussion of the price action on the weekly chart and for what to expect going into next week.
Trading Room
Traders can see the end of the day bar-by-bar price action report by signing up for free at BrooksPriceAction.com. I talk about the detailed S&P Emini futures price action real-time throughout the day in the BrooksPriceAction.com trading room. We offer a 2 day free trial.
Charts use Pacific Standard Time
When I mention time, it is USA Pacific Standard Time (the Emini day session opens at 6:30 am PST, and closes at 1:15 pm PST). You can read background information on the intraday market reports on the Market Update page.
As you know, most charts spend most of the time within nested trading ranges. Sometimes it’s better to step back about 10′ and look at the screen to try to figure out what the market is trying to do. Or, just look at the 15 or 60 min chart.
I agree about the shrinking bodies ip to 20, but it was the 1st leg up from a wedge. That wedge was a higher low and probably a pullback from the rally to 1. Since it was a wedge, a 2nd leg up was likely. Also, because it was a higher low major trend reversal setup after a big 1st leg up, the odds were good that there would either be a test of the 1 high and then a trading range or a continuation up into a bull trend. The bulls got a 2nd and 3rd leg up, but the day remained in a trading range.
13 and 31 were reasonable candidates for a swing up. They each had at least a 40% chance of a couple legs and at least 4 points profit, and probably a reward equal to at least the initial risk. That made them good Walmart trades. Take the trade, place a stop below and a profit target 4 points or more above, then go to Walmart. Come back in an hour and see how it looks.
If a person finds himself worried about every tick and having his stop hit, it often means he should try trading a smaller position. The micro Eminis are a good choice. It would give a trader a chance to see if he can manage the trade better when he is not worried about losing money. If so, then he knows what the problem is and he has to work hard to stay in his trades and trust his stop.
How do you decide where/how to trade within multiple trading ranges? If I saw range yest 47L to today’s B1H, buying DB 2nd entry 31 was buying in middle of range. Could also consider 26-31 a range and buying 31 was buying at high of that range. B35 was a brkout pb, but again breakout 31-33 had decreasing bull bodies and tail on top 33, could be range B19H-26L. I find myself constantly talking myself out of possible trend setups when obviously see TR PA over past 50 bars or so. Any help with this? Thanks