Trading Update: Wednesday September 1, 2021
Emini pre-open market analysis
Emini daily chart
- August was the 7th consecutive bull bar on the monthly chart. This Emini bull bar streak has only happened twice in the 25-year history of the Emini. There has never been a streak of 8 months. September should therefore be a bear bar on the monthly chart.
- On the monthly cash index chart, there have been 4 streaks of 8 consecutive bull bars in the past 60 years. There has never been a streak of 9 months. Therefore, September or October should be a bear bar on the cash index’s monthly chart.
- The monthly Emini chart closed on its high in a strong bull trend. That makes at least slightly higher prices likely in September. Also, the market tends to rally from August 26 to September 5. Expect more rally.
- If there is an early rally, look for a possible reversal down at the end of the month to below the open of the month. This could be the high for the remainder of the year. There are only 4 months left in the year and one will be the high of the year.
- On the daily chart, yesterday was an inside day (its high was below Monday’s high and its low was above Monday’s low). It is therefore both a buy and sell signal bar.
- Since the bull trend is strong, there are probably buyers not far below yesterday’s low if today were to get there. The bulls will continue to buy every 1- to 3-day pullback, as they have been doing for a year and a half.
- Because yesterday did not close on its high and it had a bear body, it is not a strong buy signal bar. However, the trend is strong and the odds continue to favor higher prices.
- The daily chart reached the measured move target based on the height of the pandemic crash. It might stall here for a week or so.
- Also, there have been 2 legs up from the August 19 low. A rally today would be a 3rd leg up. A 3rd leg up in a tight bull channel is a parabolic wedge. It often attracts profit takers. Therefore, the upside is probably limited to a few days before there is a 2- to 3-day pullback.
Emini 5-minute chart and what to expect today
- Emini is up 15 points in the overnight Globex session. If might gap up above the August high.
- Small gaps typically close before the bar closes. However, if a small gap on the monthly closes, it can do that at any point in the month and not necessarily on the 1st day.
- If there is a gap, there is an increased chance of a trend in either direction. Up is more likely because the bull trend is so strong on all higher time frames.
- If there is a bull trend, it could be big because the Emini might be making a blow-off top on the daily chart.
- If there is a bear trend, today could be an inside day because yesterday’s range is small.
- Today will probably open around the 4537.00 measured move target on the weekly chart, based on the height of the pandemic crash.
Yesterday’s Emini setups


Here are several reasonable stop entry setups from yesterday. I show each buy entry with a green rectangle and each sell entry with a red rectangle. Buyers of both the Brooks Trading Course and Encyclopedia of Chart Patterns have access to a much more detailed explanation of the swing trades for each day (see Online Course/BTC Daily Setups).
My goal with these charts is to present an Always In perspective. If a trader was trying to be Always In or nearly Always In a position all day, and he was not currently in the market, these entries would be logical times for him to enter. These therefore are swing entries.
It is important to understand that most swing setups do not lead to swing trades. As soon as traders are disappointed, many exit. Those who exit prefer to get out with a small profit (scalp), but often have to exit with a small loss.
If the risk is too big for your account, you should wait for trades with less risk or trade an alternative market like the Micro Emini.
EURUSD Forex market trading strategies
EURUSD Forex daily chart

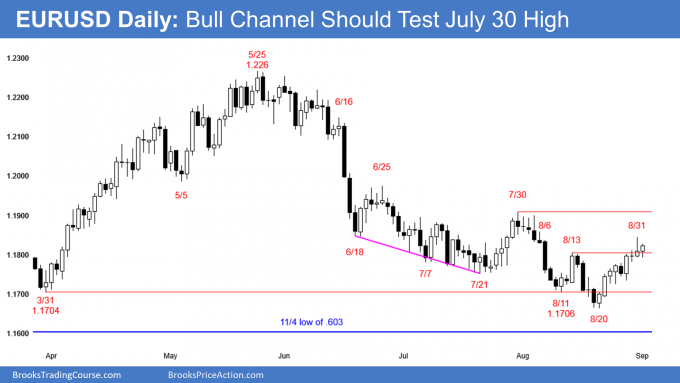
- The EURUSD broke above the August 13 lower high Friday and again yesterday. However, yesterday closed near the low of the bar, although it closed slightly above the August 13 high. It is a reversal bar and a sell signal bar for a failed breakout and for a Low 2 rally from the August 20 low.
- Yesterday had a bull body and the 8-day rally is in a tight bull channel. Therefore, once there is a reversal down, it will probably be a pullback that forms a higher low instead of a reversal down from a double top bear flag with the August 13 lower high.
- So far, there were more buyers than sellers below yesterday’s low. Today might become an outside up day.
- The bulls want a 2nd consecutive close above the August 13 high and today to close near its high. That would increase the chance that the rally will continue up to the July 30 high without more than a 1- to 2-day pullback.
Summary of today’s S&P Emini futures price action and what to expect tomorrow

End of day summary
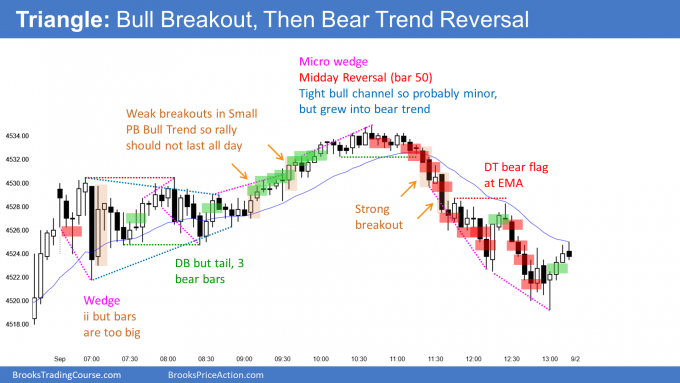
- Today began with a Trading Range Open. There was a triangle for 30 bars and then a weak bull breakout.
- The rally ended exactly at the 4537.00 measured move target on the weekly chart that is based on the pandemic crash.
- After August closed near its high, September was likely to go above the August high. The reversal down today was from just a few ticks above the August high.
- On the 5-minute chart, the reversal down went below the apex of the triangle that formed over the 1st 30 bars.
- Today was a trading range day and a bear reversal day. It closed near the low of the day and it is a sell signal bar on the daily chart.
- Today formed a micro double top with Monday’s high. However, if there is a reversal down, it will probably be minor. Bulls will buy the 1st 1- to 3-day selloff, like they have been doing for 18 months.
- The Emini should work higher in early September, but close below the open of the month. September probably will be the high for the year. Less likely it will close near its high and the rally will continue in October.
See the weekly update for a discussion of the price action on the weekly chart and for what to expect going into next week.
Trading Room
Traders can see the end of the day bar-by-bar price action report by signing up for free at BrooksPriceAction.com. I talk about the detailed S&P Emini futures price action real-time throughout the day in the BrooksPriceAction.com trading room. We offer a 2 day free trial.
Charts use Pacific Time
When I mention time, it is USA Pacific Time. The Emini day session charts begin at 6:30 am PT and end at 1:15 pm PT which is 15 minutes after the NYSE closes. You can read background information on the market reports on the Market Update page.
I assume a 10 month bull channel refered to by some newssite is refererring to cash index? (In 2017)
New sites always refer to the cash index.
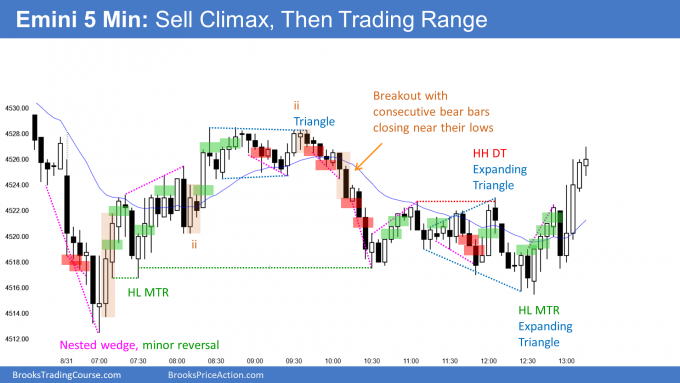
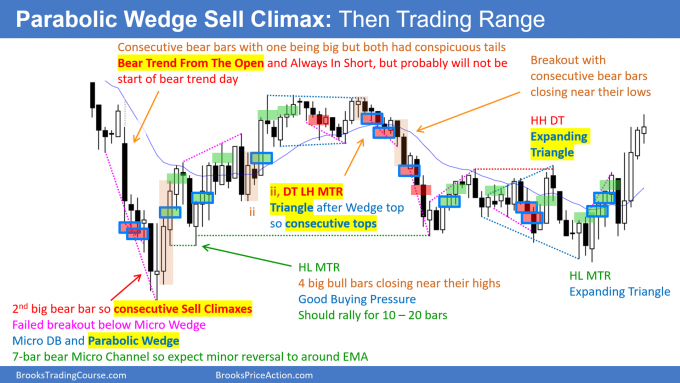
Sir, would you kindly explain as to why there are no sell marked even though the E-mini failed from above previous day’s high twice(bar 5 and bar 19) thus creating a double top on the intraday chart? Was it because you suspected a trading range and since the price never broke below the neckline of the double top, a sell did not arise?
Big bar in middle of trading range open means big risk and low probability for stop entry traders, especially with the close not below the EMA. The was only 1 close below the EMA in the 1st 19 bars. In the chat room, I said it was a bad sell and therefore probably a Buy The Close bar.
I see! Thank you very much for the detailed explanation. I am working very hard to get to a level where I can be in your chatroom and make sense out of it. I am recognizing a lot of patterns I am learning from your course and they are working exceptionally well in the markets I trade in(like you said that it works on all markets). Can not thank you enough for how drastically you have changed my way of looking at charts!
Hi Al,
While you were writing the report, the Globex traders crashed the market. What do you do when Globex and day session charts show two different pictures? On the day session yesterday ended up with a bull breakout but today the Globex chart was always in short at the open of the day session. I guess the two groups of traders annihilated each other and the result was the trading range? Thank you.
I think a trader has a better chance of making money if he thinks like Forrest Gump than like Einstein. I just trade one chart and never worry about the thousands of things I am not seeing on all of the other correlated markets and time frames.
One of the wonderful things about getting old and not seeing as well or hearing as well is that I focus on the important things. I never see or hear the imperfections that used to bother me, and now everyone looks and sounds better.
The same with the charts. I step back and don’t see the wrinkles. What I do see is beautiful.