Emini and Forex Trading Update:
Wednesday April 24, 2019
I will update again at the end of the day.
Pre-Open market analysis
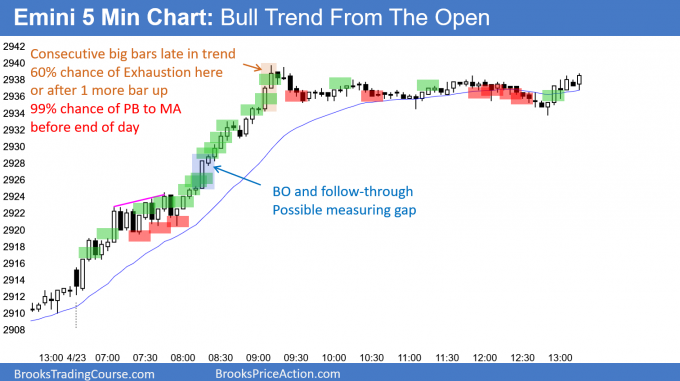
Yesterday was an extremely strong bull trend after a 6 day pause in the bull trend. Its high was about 16 points below the all-time high.
The bears had a credible minor top last Wednesday. Yesterday broke far above that high. Because the size of yesterday’s trend was a surprise, the odds favor at least a small 2nd leg up within a few days. It might come today. If so, today could break to a new all-time high.
Because yesterday was climactic on the 5 minute chart, there is a 75% chance of at least a couple hours of sideways to down trading today that begins by the end of the 2nd hour.
Overnight Emini Globex trading
The Emini is unchanged in the Globex session. It will probably open within yesterday’s 4 hour trading range. The day after a huge day is often a small trading range day. A trading range day has at least one small swing up and one small swing down.
The all-time high is only 16.25 points above yesterday’s high. That is within reach today. However, yesterday’s 4 hour trading range means that the bulls are exhausted. They therefore might wait a few days before buying aggressively again and getting a new high.
Can today be a big trend day? After yesterday’s 4 hour tight trading range and with the all–time high not far above, today will probably not be another big bull day. With the all-time high an obvious magnet above and with yesterday’s strong momentum up, today will probably not be a big bear day. The bulls and bears will both probably be cautious. This increases the chance of a smaller day today with legs up and down.
Yesterday’s setups

Here are several reasonable stop entry setups from yesterday. I show each buy entry with a green rectangle and each sell entry with a red rectangle. I rarely also show limit order entries and entries on the close of bars. Buyers of the Brooks Trading Course have access to a much more detailed explanation of the swing trades for each day.
My goal with these charts is to present an Always In perspective. If a trader was trying to be Always In or nearly Always In a position all day, and he was not currently in the market, these entries would be logical times for him to enter.
EURUSD Forex market trading strategies

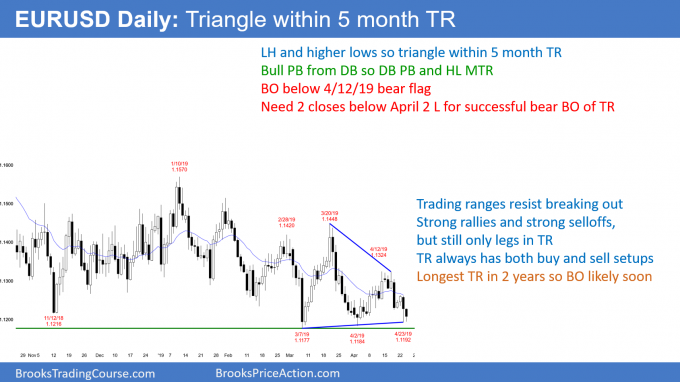
The EURUSD daily Forex chart has been in a trading range for 5 months and a triangle for 1 month. This is the longest trading range in 2 years and therefore the odds favor a breakout soon.
Trading ranges always look bearish when the market is near the bottom and bullish near the top. However, they could not continue if either side had a significant advantage. Consequently, traders will continue to bet on reversals until there is a clear breakout. They typically want to see consecutive closes above or below the range before they will switch to trend trading.
Overnight EURUSD Forex trading
The EURUSD 5 minute Forex chart has been in a 30 pip range overnight. In addition, it is within yesterday’s range. Because it is testing the low of the 5 month range, traders are prepared for either a reversal or a breakout. Either could lead to a big trend day.
More likely, today will continue to be quiet. The bulls will try to get the day to close above the open. It would then be a bull inside bar on the daily chart. In addition, it would form a micro double bottom with yesterday’s low. This would be a buy signal for a reversal up from the bottom of the 5 month range.
The bears always want the opposite. Not only do they want a bear day on the daily chart, they would prefer to get the day to close on its low. Today would then be a sell signal bar on the daily chart. This would increase their chance of breaking below the 5 month range tomorrow. They then would hope for a series of bear days over the next few weeks.
Because today so far is small, traders are probably looking at it as a potential buy or sell signal bar for tomorrow on the daily chart. The bulls will buy dips and try to get the day to close near the high. The bears will sell rallies and try to get the day to close near its low. While a breakout could come today, it is unlikely with the bars and range as small as they are.
Summary of today’s S&P Emini futures price action and what to expect tomorrow
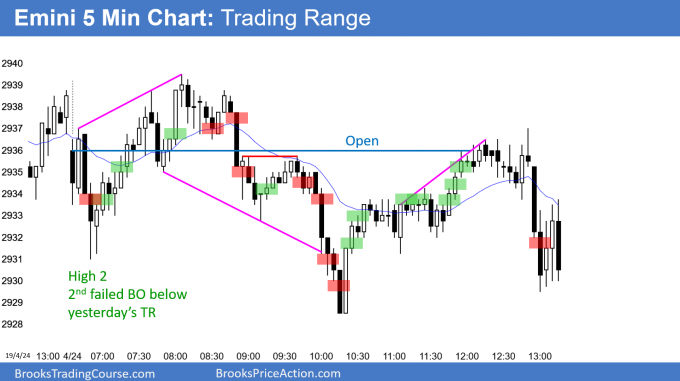
Here are several reasonable stop entry setups for today. I show each buy entry with a green rectangle and each sell entry with a red rectangle. I rarely also show limit order entries and entries on the close of bars. Buyers of the Brooks Trading Course have access to a much more detailed explanation of the swing trades for each day.
My goal with these charts is to present an Always In perspective. If a trader was trying to be Always In or nearly Always In a position all day, and he was not currently in the market, these entries would be logical times for him to enter.
End of day summary

Today was a small trading range day after yesterday’s strong bull trend day. There were expanding triangle tops and bottoms. The bulls see today as a buy signal bar for tomorrow. However, the bears see it as a sell signal bar for a failed breakout.
But, when a breakout is as big as yesterday’s was, there is typically at least a small 2nd leg up. Consequently, there are probably buyers not too far below today’s low.
See the weekly update for a discussion of the price action on the weekly chart and for what to expect going into next week.
Trading Room
Traders can see the end of the day bar-by-bar price action report by signing up for free at BrooksPriceAction.com. I talk about the detailed S&P Emini futures price action real-time throughout the day in the BrooksPriceAction.com trading room. We offer a 2 day free trial.
Charts use Pacific Standard Time
When I mention time, it is USA Pacific Standard Time (the Emini day session opens at 6:30 am PST, and closes at 1:15 pm PST). You can read background information on the intraday market reports on the Intraday Market Update page.
Hey Al,
In the past you mentioned about a friend that would place his trades and then go for walk and come back after a couple of hours. Lately, I’ve been wanting to do that because I find myself getting out too early and wish that I had held on and stuck with my original target. The issue I find with walking away from the screen is that I won’t be able to really manage it. I will just be relying on my stop. Do you think in general it’s a good idea to walk away and not touch it on the 5min chart?
I think if a trader finds himself regularly getting scared out of good trades and he is not sticking to his plan, he needs to try to find a way to improve. One is that Walmart strategy that I sometimes mention.
I traded online for years with a very profitable trader who used to wait for a swing setup in the morning, enter, place a bracket order (a protective stop and a profit taking limit order), then leave for a couple of hours to run errands. Theoretically, if he stayed, he might have been able to make more profit, but he might have exited too early as well. I did not keep track of his winning percentage with this approach, but it was incredibly high for a swing trader. I believe it was 70% or better.
Gotcha, thanks!