Emini and Forex Trading Update:
Friday June 7, 2019
I will update again at the end of the day.
Pre-Open market analysis
The Emini has rallied for 4 days from just above the gap above the February 11 high. The bulls hope this is a resumption of the 2019 bull trend.
Today is Friday. This week traded below last week’s low and above last week’s high. This week is therefore an outside up candlestick on the weekly chart. Traders see it as a buy signal bar for next week.
But, there has been no pullback in the bear channel on the weekly chart in 5 weeks. Therefore, the odds are that the first reversal up will not get far. Consequently, the buy signal will probably only lead to another week or two of higher prices. There will then likely be a test back down and an attempt to close the February 11 gap.
The bears want a lower high and then a selloff that will close that gap. After a strong 4 day rally, the bears will probably need at least a micro double top. Traders assume that the Emini will not pull back for more than a day or two before beginning at least a small 2nd leg up.
Today is Friday so weekly support and resistance are important, especially in the final hour. The most important price is last week’s high. The bulls want the week to close above last week’s high as a sign of strength. That would increase the chance of higher prices next week. The bears always want the opposite. However, even if today sells off, the week will still be a big bull trend bar on the weekly chart.
Overnight Emini Globex trading
The Emini was up ahead of today’s unemployment report, but sold off on the report. Ten minutes later, it rallied to a new high, and then pulled back again. These abrupt reversals increase the chance of trading range trading today.
The bulls want the week to close on its high. Because the daily chart is overbought, there is therefore an increased chance of profit taking today. However, the momentum up has been strong. The bulls might be able to get another bull trend day.
Last week’s high is a magnet, especially in the final hour. If today sells off early and gets back there, it might then oscillate around it for the rest of the day.
Yesterday’s setups

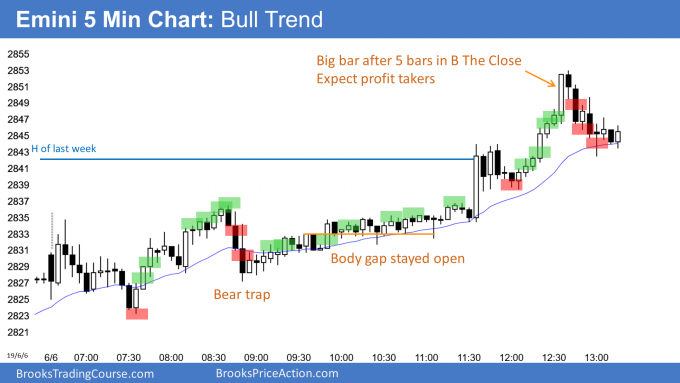
Here are several reasonable stop entry setups from yesterday. I show each buy entry with a green rectangle and each sell entry with a red rectangle. I rarely also show limit order entries and entries on the close of bars. Buyers of the Brooks Trading Course have access to a much more detailed explanation of the swing trades for each day.
My goal with these charts is to present an Always In perspective. If a trader was trying to be Always In or nearly Always In a position all day, and he was not currently in the market, these entries would be logical times for him to enter.
EURUSD Forex market trading strategies
The EURUSD daily Forex chart formed an outside up day yesterday. Wednesday was an outside down day. An outside up day after an outside down day is a buy signal bar. The bulls want today to go above yesterday’s high because that would trigger the buy signal.
There are two problems with the setup. First, yesterday had a big tail on top. It did not close above Wednesday high. That is a sign of tentative bulls and it reduces the chance of a big rally.
The second problem is more important. The daily chart has been in a bear channel for a year. During every strong rally and every strong selloff, I have said that trends resist change and reversals are more common than breakouts. Consequently, the odds are that this buy setup will only lead to another lower high and be followed by another new low in the channel.
But the channel has lasted an unusually long time. Traders therefore expect a breakout to come at any time.
Overnight EURUSD Forex trading
The EURUSD 5 minute Forex chart was in a 30 pip range overnight ahead of today’s unemployment report. It rallied on the report and broke above yesterday’s high. That triggered the buy signal on the daily chart. It therefore increases the chance of higher prices over the next week.
Failed breakouts are common when the daily chart is in a channel or trading range. Consequently, it is too early to know if today will remain a bull trend day. It could still reverse into a bear trend. Remember, the bears want the buy signal to fail.
However, at the moment, the odds favor higher prices over the next several days. Also, if the bulls keep the market above the 1.1268 start of this morning’s rally, the odds will favor higher prices today. Traders will therefore look to buy pullbacks. If today closes above yesterday’s high, the odds of higher prices next week go up.
There is always a bear case. At a minimum, they will sell rallies and try to get today to close below yesterday’s high. They would prefer today to close on its low. Day traders should wait to sell until after they see a strong reversal down or at least an hour of sideways trading. Without that, the odds favor sideways to up trading today and follow-through buying next week.
Summary of today’s S&P Emini futures price action and what to expect tomorrow

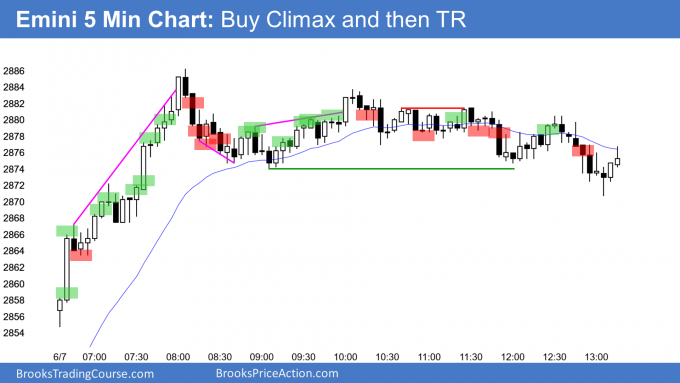
Here are several reasonable stop entry setups for today. I show each buy entry with a green rectangle and each sell entry with a red rectangle. I rarely also show limit order entries and entries on the close of bars. Buyers of the Brooks Trading Course have access to a much more detailed explanation of the swing trades for each day.
My goal with these charts is to present an Always In perspective. If a trader was trying to be Always In or nearly Always In a position all day, and he was not currently in the market, these entries would be logical times for him to enter.
End of day summary
Today had an extremely strong, climactic rally on the open and the Emini then entered a trading range.
This week was an outside up bar on the weekly chart. It is therefore a buy signal bar for next week. However, its range is huge and therefore the stop for the bulls is far below. Many bulls will prefer to buy a pullback than above last week’s high.
The daily chart has been in a trading range for 5 months. Traders know that there is an increased chance that the bulls will be disappointed by a lack of follow-through buying next week. For example, next week might be an inside bar on the weekly chart.
At the moment, the rally is strong enough to test the all-time high. However, trading ranges resist breaking out. Consequently, there is a 50% chance that this rally will form a lower high and simply be another leg in the 5 month trading range.
Because last week’s buying was unusually strong, the bulls will probably begin to take profits early next week. That will result in a 1 – 2 day pullback. However, there will be other bulls looking to buy the 1st pullback. Consequently, the downside risk early next week is small.
See the weekly update for a discussion of the price action on the weekly chart and for what to expect going into next week.
Trading Room
Traders can see the end of the day bar-by-bar price action report by signing up for free at BrooksPriceAction.com. I talk about the detailed S&P Emini futures price action real-time throughout the day in the BrooksPriceAction.com trading room. We offer a 2 day free trial.
Charts use Pacific Standard Time
When I mention time, it is USA Pacific Standard Time (the Emini day session opens at 6:30 am PST, and closes at 1:15 pm PST). You can read background information on the intraday market reports on the Intraday Market Update page.
Hi Al,
May I ask, why would you not place a stop-order entry above either b32 or b33 after the pullback test at the 20EMA?
Thank you,
Tim
That was my mistake. I work on several slides at a time and they do not all show the same things. I just put in the missing buys.
Thank you, sir.
Hello Al,
How many times in a month do you think bar one is the best stop entry for getting on board a 10 pt move off the open?
Thanks,
Daniel
In my data set of 1293 trading days:
On days where bar 1 is a Bull bar closing above the midpoint, the market went at least 10.5 points above the high of bar 1 on 96 days before going below the low of bar 1 (i.e., 7.4% of days.)
On days where bar 1 is a Bear bar closing below its midpoint, the market went at least 10.5 points below the low of bar 1 on 107 days before going above the high of bar 1 (i.e., 8.3% of days.)
Bob
Thanks for the stats Bob.
I usually wait for 2 bars but found myself trapped out for most of the day. (I stop trading around 9-10am).
I’m going to dig in and do some stats research on Multicharts this weekend. Thanks again.
Daniel