Emini buy climax is testing 2800 triple top
I will update again at the end of the day.
Pre-Open market analysis
This is the start of the 9th week in a strong bull trend. But, 9 consecutive bull bars on the weekly chart is rare. Therefore, either this week or next week will probably have a bear body. Furthermore, there is a parabolic wedge rally on the daily chart. That will probably lead to at least a 2 week pullback.
Because the momentum up is strong, the bulls keep buying. They are trying to break above the October-November-December triple top. With last week closing on its high, this week might gap up. If so, the bulls will try to keep the gap open and continue the rally to above the top.
A pullback has been likely, but it has not yet begun. Therefore, if there is a break above the triple top, it could be big. If there are too many institutions betting on the pullback, they might buy back their shorts in a panic if the bulls get their breakout.
Overnight Emini Globex trading
The Emini is down 8 points in the Globex session. There is a parabolic wedge top on the daily chart. It increases the odds of a 2 – 3 week selloff. This is especially true with the buy climax on the weekly chart.
However, Friday was a bull day closing on its high. Typically a chart has to stop going up before reversing down. Therefore, today will probably not be a big bear day.
In addition, the past 3 days were mostly sideways on the 5 minute chart. The strong bull trend on the daily chart is losing momentum now that it is near last year’s triple top. As a result, a strong bull day is also unlikely. That makes another mostly sideways day likely.
Because the momentum up is strong and the daily chart is at resistance, there is a small, but real chance of a series of big bull days. Likewise, the buy climax at resistance increases the chance of a dramatic selloff for several weeks.
Neither is likely. But, if either becomes clear, traders should not be in denial. There is the potential for a surprisingly big move up or down within a couple weeks.
Friday’s setups

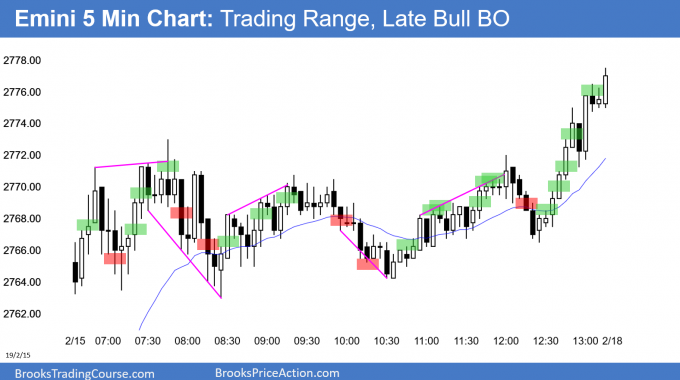
Here are several reasonable stop entry setups from Friday. I show each buy entry with a green rectangle and each sell entry with a red rectangle. I rarely also show limit order entries and entries on the close of bars. My goal with these charts is to present an Always In perspective. If a trader was trying to be Always In or nearly Always In a position all day, and he was not currently in the market, these entries would be logical times for him to enter.
EURUSD Forex micro wedge bottom

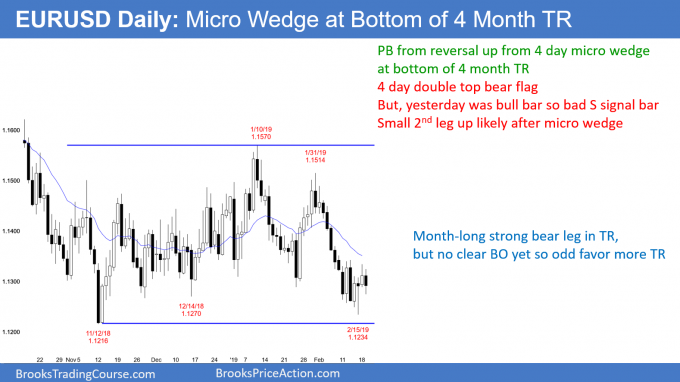
The EURUSD daily Forex chart formed a 4 day micro wedge bottom. Yesterday was a bull bar and therefore the 1st leg up. A micro wedge typically leads to at least 2 legs up. Therefore, today or tomorrow will probably form a higher low.
Yesterday was also a sell signal bar for a double top bear flag with Thursday’s high. Since yesterday had a bull body, this is a low probability sell signal. As a result, there will likely be more buyers than sellers below yesterday’s low. That is consistent with the micro wedge, which will probably to lead to a small 2nd leg up.
While the month-long selloff has been strong and it fell below the December low, it is still a leg in the 4 month range. There have been many strong legs up and down. Each reversed. That is always what is most likely in a trading range. Consequently, the odds are that this one will as well.
However, every trading range over the past 2 years broke out after about 2 months. Therefore, the odds are increasing that one of the legs will lead to a successful breakout. But, until there is a breakout, there is no breakout. The math is still better to bet on a reversal back up to the middle of the range.
Overnight EURUSD Forex trading
The EURUSD 5 minute Forex chart fell below yesterday’s low overnight. As was likely, the bulls bought the breakout since the sell setup on the daily chart was bad. Yesterday’s low might be important all day. The bears want today to close below yesterday’s low while the bulls want it to close above.
While the over night range was 50 pips, the range over the past 3 hours has only been 25 pips. In addition, most of the bars are only about 5 – 7 pips tall. That means that the chart lacks energy. Traders believe that the price is just about right. Day traders are scalping. This is consistent with the chart being in a tight trading range for 6 days.
Because the chart is at the bottom of a 4 day range, there is a slightly increased chance of a big bear breakout or big reversal up. But, until there is a clear breakout, day traders will continue to scalp.
Summary of today’s S&P Emini futures price action and what to expect tomorrow

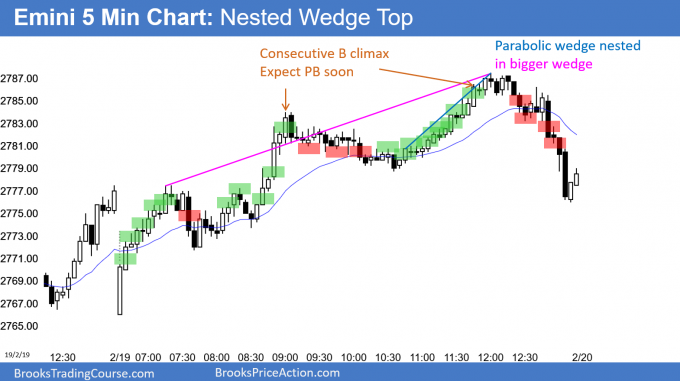
Here are several reasonable stop entry setups for today. I show each buy entry with a green rectangle and each sell entry with a red rectangle. I rarely also show limit order entries and entries on the close of bars. My goal with these charts is to present an Always In perspective. If a trader was trying to be Always In or nearly Always In a position all day, and he was not currently in the market, these entries would be logical times for him to enter.
End of day summary
The Emini began with a Bull Trend From The Open. After a midday trading range, the bull trend resumed and closed near its high.
By today closing above its open, this week so far is the 9th consecutive bull trend bar on the weekly chart. There has only been one longer streak in the 20 year history of the Emini. Consequently, the odds favor a 2 – 3 week pullback beginning this week.
But, the momentum up is strong. Most importantly, the triple top above 2800 is a strong magnet. The bulls have failed many times over the past year to break strongly above 2800. While they will probably succeed at some point this year, the buy climax makes a 2 – 3 week pullback likely to come before the breakout.
Since the pullback will probably begin this week or next, traders will be looking for a reversal on the daily chart. However, many institutions are probably betting on the pullback. Therefore, there is a chance of a strong break above 2800. Those institutions will cover their shorts, and other institutions will buy the breakout, looking for a test of the all-time high.
See the weekly update for a discussion of the price action on the weekly chart and for what to expect going into next week.
Trading Room
Traders can see the end of the day bar-by-bar price action report by signing up for free at BrooksPriceAction.com. I talk about the detailed S&P Emini futures price action real-time throughout the day in the BrooksPriceAction.com trading room. We offer a 2 day free trial.
Charts use Pacific Standard Time
When I mention time, it is USA Pacific Standard Time (the Emini day session opens at 6:30 am PST, and closes at 1:15 pm PST). You can read background information on the intraday market reports on the Intraday Market Update page.
Hi Al, what is the key difference b/w a bull micro channel and a tight bull channel? looks like you call it a bull micro channel if it doesn’t have any bear bars (only bull bars or doji), and call it tight bull channel if it has one or a couple bear bars?
Hi Mgtyrael,
The key difference is no pullbacks for a Micro Channel. For a tight channel, with pullbacks, it is difficult to make money trading with stops (countertrend or TTR).
You can study this in detail in 17A Tight Channels and Micro Channels.
Thanks Richard.
Is there any reason I should not have bought above 39, a bull bar closing near its high after a H2 bull flag, close to the MA, and always in long? I did, and exited below 43 for a 2.5 point loss.
After 3 consecutive bear bars and EMA20 magnet below has not been tested. Also, I believe there are buyers above H of 26 which thus might be tested.
There are many reasons not to buy, but also many to buy (it is AIL).
Swinging or scalping? Where is your stop for either? What is the probability
for a swing or scalp?
Context is a tight trading range, bar 39 is in it and not reversing anything, therefore
it is not the H2 you were looking for. The H2 you perhaps were looking for was bar 51.
Context is a filter for applying patterns, bar 39 was a H2 on a faster chart but low probability,
not much reward. So swing it with a stop below bar 24. That stop wasn’t hit and 4 pts could have been made after moving stop to bar 49. Check out a slower chart and bar 51 was the
higher probability trade for a 2pt scalp.
Blindly taking patterns without context, and not considering probabilities, the math just ain’t gonna be good.
There was nothing wrong with taking that trade. In fact I bought it.
The bull leg and breakout was strong, the reversal was weak (where is the bear urgency?)
The two bar reversal could not even trigger, the follow through was sideways and weak.
It was perfectly reasonable to buy for at minimum a test of the high close or another buy climax, or an actual strong reversal.
Did it immediately rally? No. Not all trades work out. Atleast 40% of the time they do not.
However it was a profitable trade depending on how you managed it.
It was also profitable to exit when it failed and re-enter above the following buy setups.
Anyone who believes they can pick a winning trade before it plays out and avoid losing trades
is more than likely not making money.
You have to take every reasonable trade that meets your edge, regardless if you think it will fail or succeed.
Josh
I agree with you. The buying above 39 turned to be a red result is PRB because the reasonable stop should be below L of 24. but we all have different tolerance of risk, so there is no black-white wrong and right here.