Emini and Forex Trading Update:
Wednesday July 1, 2020
I will update again at the end of the day.
Pre-Open market analysis
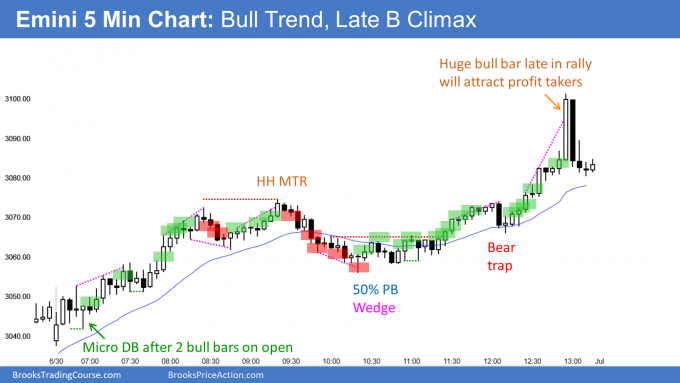
By going above Monday’s high yesterday, the Emini triggered a buy signal on the daily chart. I have been saying since Friday that the Emini would probably rally this week. Yesterday was a strong bull trend day. It briefly traded above the 3100.00 Big Round Number at the end of the day and pulled back sharply.
Yesterday had a dramatic rally and selloff into the close of the month and of the 2nd quarter. Because the buying was so climactic, there is a 75% chance of at least a couple hours of sideways to down trading today that starts by the end of the 2nd hour. The late reversal down might be the start. The uncertainty regarding tomorrow’s unemployment report is another factor that increases the chance of trading range trading today.
Monthly chart had bull doji in June
On the monthly chart, June had a small bull body with big tails above and below. It was basically a doji bar, and it was at the top of a 2 1/2 year trading range. That does not give traders much information regarding what to expect in July.
Because the Emini is near the top of the range, the upside in July is not great. However, after 3 bull bars on the monthly chart, the bears do not expect a bear trend. Therefore, traders expect the trading range to continue in July. The bulls have a 50% chance of a new high this summer.
Also, if the Emini trades below the June low, traders expect the selloff to end after a month or two, near the middle of the trading range.
Overnight Emini Globex trading
The Emini is down 12 points in the Globex session. Today and tomorrow are important days. If the bulls get one or two more bull trend days, the odds of a new all-time high will be more than 50%. If there is a big reversal down, traders will expect a correction down to the middle of the 2 1/2 year trading range.
Because yesterday had a huge climactic reversal, the 5 minute chart has a Big Up, Bid Down pattern. That creates Big Confusion. Since confusion is a hallmark of a trading range, traders expect at least a couple hours of trading range trading. It might begin on the open.
Huge moves like the 2 big bars at yesterday’s close often lead to a measured move. It can be up or down. If it is down, the Emini would test yesterday’s higher low.
If the move is going to be up, the Emini will probably 1st have to go sideways for a couple of hours before the exhausted bulls will buy aggressively again.
Yesterday’s setups

Here are several reasonable stop entry setups from yesterday. I show each buy entry with a green rectangle and each sell entry with a red rectangle. I rarely also show limit order entries and entries on the close of bars. I do not want the lines to be distracting. If they are longer, I make them dotted. But, they have to be visible, so I make the shorter ones solid. Buyers of the Brooks Trading Course and Encyclopedia of Chart Patterns have access to a much more detailed explanation of the swing trades for each day (see Online Course/BTC Daily Setups).
My goal with these charts is to present an Always In perspective. If a trader was trying to be Always In or nearly Always In a position all day, and he was not currently in the market, these entries would be logical times for him to enter.
If the risk is too big for your account, you should wait for trades with less risk or trade an alternative market like the Micro Emini.
EURUSD Forex market trading strategies

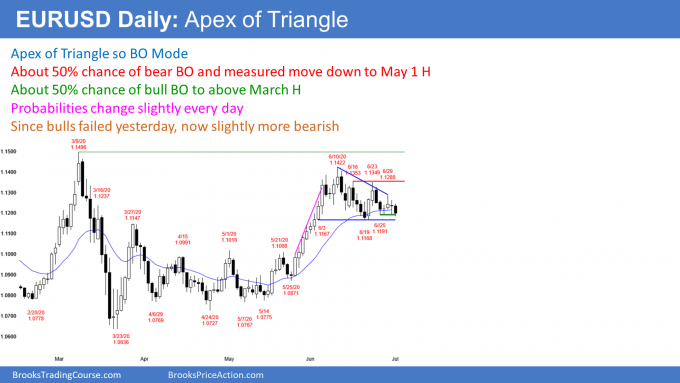
The EURUSD Forex market on the daily chart has been sideways for a month. It is in Breakout Mode. The pattern is now a triangle. Like all Breakout Mode patterns, there is a 50% chance of either a successful bull or bear breakout. Furthermore, there is a 50% chance that the 1st breakout will fail.
When the EURUSD is at the apex of a triangle, the bars get small and the reversals come every day or two. It is a Limit Order market. That means there are usually more buyers below bars and sellers above bars. Traders bet on reversals instead of a breakout into a trend.
Eventually there is a breakout. It often follows news. Tomorrow’s US unemployment report is a possible catalyst.
Overnight EURUSD Forex trading
The 5 minute chart of the EURUSD Forex market went sideways on the open, but sold off over the past few hours. It traded below yesterday’s low and bounced. Remember, Breakout Mode pattern is a Limit Order market. There are usually more buyers below the prior day’s low betting on a reversal up than sellers selling and betting on a trend down.
While a successful breakout can come at any time, most attempts will lead to reversals. Consequently, the overnight selloff will probably have bad follow-through.
Traders expect a trading range around yesterday’s low instead of a strong breakout below the bottom of the 4 week trading range. Therefore, day traders will be willing to both buy and sell. Additionally, since they know the odds are against a big move, they will scalp for 10 – 20 pips.
But, they know a strong breakout can come any day. If there is a series of big trend bars up or down, they will switch to swing trading.
Summary of today’s S&P Emini futures price action and what to expect tomorrow

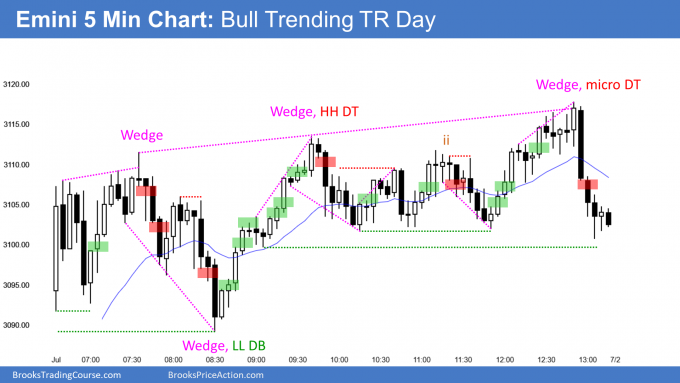
Here are several reasonable stop entry setups for today. I show each buy entry with a green rectangle and each sell entry with a red rectangle. I rarely also show limit order entries and entries on the close of bars. I do not want the lines to be distracting. If they are longer, I make them dotted. But, they have to be visible, so I make the shorter ones solid. Buyers of the Brooks Trading Course and Encyclopedia of Chart Patterns have access to a much more detailed explanation of the swing trades for each day (see Online Course/BTC Daily Setups).
My goal with these charts is to present an Always In perspective. If a trader was trying to be Always In or nearly Always In a position all day, and he was not currently in the market, these entries would be logical times for him to enter.
If the risk is too big for your account, you should wait for trades with less risk or trade an alternative market like the Micro Emini.
End of day summary
After yesterday’s reversal down from an extreme buy climax, traders expected at least a couple hours of sideways trading. Today was a bull trending trading range day. It closed in the middle of the day’s range.
Because there is a parabolic wedge rally on the 60 minute chart, the Emini might pull back tomorrow or Monday. However, the 3 day rally was strong enough to make at least slightly higher prices likely next week.
Tomorrow is the last trading day of the week because the markets are closed on Friday. Tomorrow’s unemployment report is less certain than normal. There is therefore an increased potential for a surprisingly big gap and then big trend day up or down. If there is a big rally, this week could become an outside up bar on the weekly chart.
See the weekly update for a discussion of the price action on the weekly chart and for what to expect going into next week.
Trading Room
Traders can see the end of the day bar-by-bar price action report by signing up for free at BrooksPriceAction.com. I talk about the detailed S&P Emini futures price action real-time throughout the day in the BrooksPriceAction.com trading room. We offer a 2 day free trial.
Charts use Pacific Standard Time
When I mention time, it is USA Pacific Standard Time (the Emini day session opens at 6:30 am PST, and closes at 1:15 pm PST). You can read background information on the intraday market reports on the Market Update page.
Is the pullback on monday still in play from the parabolic wedge on the 60 min?
I see that yes it is. Actually looks like a possibly triangle breakout to the upside on the daily, but possibly a false breakout and a move lower now?
Definitely looks like it.. if you see:
AAPL – micro double top
Nasdaq index, MSFT, all have 3 push up, and which are wedge testing the trend channel line.
AMZN – parabolic wedge, and a breakout of the trend channel line – which may fail
I would say the probability of a pullback only is good.
How strong the pullback remains to be seen. Strong pullback, big selling pressures, then I would expect much lower prices.
Weak pullback with many overlapping bars, chances are bulls will buy the pullback and the rally will continue again next week.
Just my 2 cents..
Also on the SPX, it looks like a LH DT MTR.
But the up leg is strong, so probability of a second leg sideways to up is there.
Anyway, weekend is here.. happy independence day to all celebrating it.
Al, what do you think of the probability of this playing out..
1) Price is rallying during this traditionally bullish window
2) Earnings seasons is kicking off on the 14th July – which numbers are expected to be bad. This could cause at least a pullback.
3) Feds have anticipated this, which is why they are timing the next stimulus announcements towards the end of July, which will provide the next push up from the earnings pullback.
Thanks for your input.
I talked about this a few times. The market is going up because of only one thing. The Fed said it will print infinite money to protect the economy. Nothing else really matters.
At some point, the bulls will think that the Fed’s floor is too far below and they will take profits. No one knows where the Fed floor is and no one knows when the bulls will take profits and probe down to find the floor. In the meantime, the greater fools theory is prevailing.
You are right about the bullish window ending this week and that earnings will be bad. But, earnings are already priced in. Everyone knows they will be bad, but who cares? The Fed is giving money to everyone. Lots of money to buy stock.
The Fed is not going to make any changes ahead of the election.
Al, thanks for the clarification..
Alright noted and agreed that the earnings are priced in already..
Its one thing to study about a bubble, its another to actually to be in one.. its just unbelievable seeing it happening..
Nasdaq looks like it will hit another channel line in the weekly close to 11,000.
AMZN, AAPL, MSFT are up straight, reminiscence of the bitcoin craze..
and Feds are printing money.. it all seems so surreal..