Emini and Forex Trading Update:
Wednesday May 22, 2019
I will update again at the end of the day.
Pre-Open market analysis
The Emini formed a sixth consecutive bull trend bar yesterday on the daily chart. That is unusual because it has been in a trading range for 2 weeks. Normally, there would be a bear bar within a few days.
It is a sign of buying pressure. In fact, there have only been 2 bear bars in the past 13 days. This makes the bulls ready to buy aggressively once they conclude that the 3 week correction has ended.
That is not yet clear. However, every bull bar that gets added makes a new all-time high increasingly likely. At the moment, the probability is about 50%. The bears still want a lower high and a closure of the gap above the February 8 high.
Whether or not the bears close that gap, the bulls will still probably get a new high this summer.
60 minute chart has head and shoulders bottom
There is a head and shoulders bottom on the 60 minute chart. It is important to note that this means there is also a double top, 3 pushes down, and a higher low. Consequently, every head and shoulders pattern is also a triangle, which is a breakout mode pattern.
Here, the bears have a double top and the bulls have a higher low major trend reversal. Both are major patterns. Once a major pattern has a good signal bar, it only has a 40% chance of leading to a major move. Because the chart is now at its apex, traders expect a breakout within a few days.
Whenever there is a breakout mode pattern, traders should expect that the initial breakout will fail and reverse 50% of the time. Additionally, they know that the probability of a successful breakout is the same for the bulls and the bears.
Overnight Emini Globex trading
The Emini is down 12 points in the Globex session. It might gap below yesterday’s low. Since yesterday gapped up, if a gap down today stays open, yesterday will be a 1 day island top on the daily chart.
However, island tops and bottoms are minor reversal patterns. Other factors are usually more important. Here, the most important factor is the breakout mode pattern on the daily and 60 minute charts. There is an increased chance of a series of trend days up or down beginning soon.
There is one final interesting point. A breakout mode pattern is neutral, yet there have been 6 consecutive bull bars on the daily chart. Consequently, the odds favor a bear bar today. Day traders will be inclined to look for a reversal down whenever there is a rally above the open. This is especially true in the final hour.
Yesterday’s setups

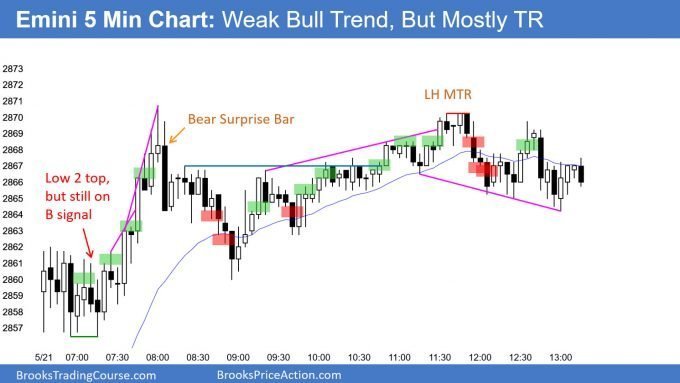
Here are several reasonable stop entry setups from yesterday. I show each buy entry with a green rectangle and each sell entry with a red rectangle. I rarely also show limit order entries and entries on the close of bars. Buyers of the Brooks Trading Course have access to a much more detailed explanation of the swing trades for each day.
My goal with these charts is to present an Always In perspective. If a trader was trying to be Always In or nearly Always In a position all day, and he was not currently in the market, these entries would be logical times for him to enter.
EURUSD Forex market trading strategies

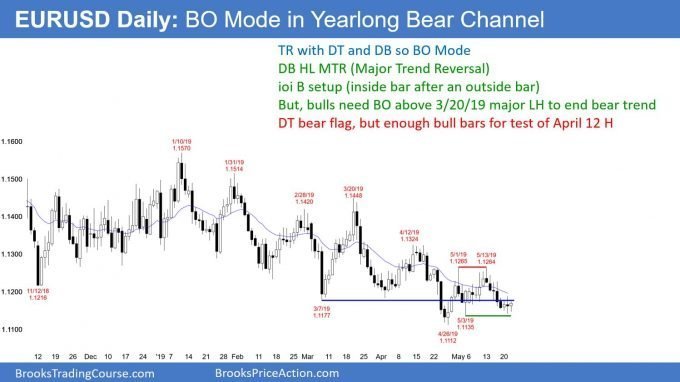
The EURUSD daily Forex chart is trying to form a double bottom with the May 3 low. This is a potential double bottom higher low major trend reversal buy signal.
So far, today is a bull bar and its low is above yesterday’s low. Its high is below yesterday’s high. Today is therefore an inside day on the daily chart. Yesterday was an outside day, which means that Friday was within yesterday’s range. This is an ioi (inside-outside-inside) breakout mode pattern.
Since it is at the bottom of a 3 week trading range, a breakout above today’s high and a rally is more likely than a breakout below today’s low and then the April 52 week low.
But, the chart has been in a bear channel for a year. That means that it is forming a series of lower highs and lows.
There have been many buy signals and many rallies. However, each lasted only 2 – 3 weeks, and each led to a new low.
There is no reason to believe that any rally here will be different from all of the others. If the bulls trigger the buy signal tomorrow, they will probably get a 2 – 3 week rally to above the May 1/May 13 double top. Traders should expect it to reverse down from below the March 20 major lower high.
Overnight EURUSD Forex trading
The EURUSD 5 minute Forex chart has rallied 30 pips from above yesterday’s low. The bulls want a reversal up from the May 3 low, and therefore want today to be a bull bar on the daily chart.
If the bulls get a bull bar closing near its high and today is an inside day, today would be an ioi buy signal bar for tomorrow. They do not need a huge trend. In fact, the buy setup will be stronger if today does not break above yesterday’s high. This is because a big day will force traders tomorrow to buy higher than they want. Many will refuse, and there would be an increased chance of more sideways days.
An ioi pattern is a breakout mode setup. The bears want today to have a bear body. Today would then be a sell signal bar for tomorrow.
However, the EURUSD daily chart is at the bottom of a 3 week trading range. Reversals are more common than successful breakouts. Consequently, this would be a low probability sell setup.
If the sell signal triggered, it would probably fail. Traders know that the odds favor a reversal up from the bottom of a 3 week trading range and near the bottom of a yearlong bear channel.
Summary of today’s S&P Emini futures price action and what to expect tomorrow

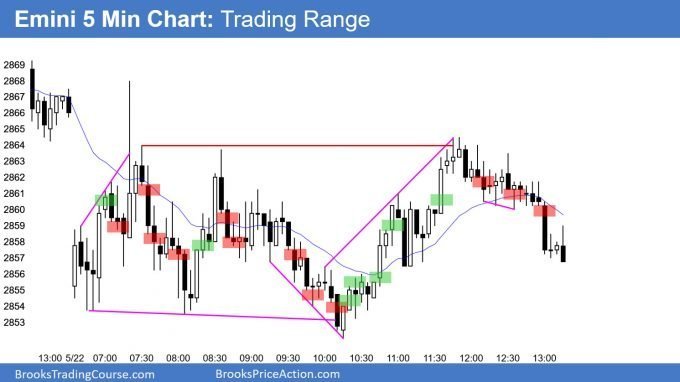
Here are several reasonable stop entry setups for today. I show each buy entry with a green rectangle and each sell entry with a red rectangle. I rarely also show limit order entries and entries on the close of bars. Buyers of the Brooks Trading Course have access to a much more detailed explanation of the swing trades for each day.
My goal with these charts is to present an Always In perspective. If a trader was trying to be Always In or nearly Always In a position all day, and he was not currently in the market, these entries would be logical times for him to enter.
End of day summary
The Emini was in a trading range today. There is triangle on the 60 minute and daily charts and therefore both are in Breakout Mode patterns. Traders know that there is a 50% chance that the correction is over. They also know that there is a 50% chance that the selloff will close the gap above the February 8 high.
Since the daily chart is at the apex of a triangle, there will probably be a breakout attempt within the next few days. This is a neutral pattern. Yet, the past 7 days on the daily chart have bull bodies. That is unusual and tomorrow will therefore probably have a bear body.
See the weekly update for a discussion of the price action on the weekly chart and for what to expect going into next week.
Trading Room
Traders can see the end of the day bar-by-bar price action report by signing up for free at BrooksPriceAction.com. I talk about the detailed S&P Emini futures price action real-time throughout the day in the BrooksPriceAction.com trading room. We offer a 2 day free trial.
Charts use Pacific Standard Time
When I mention time, it is USA Pacific Standard Time (the Emini day session opens at 6:30 am PST, and closes at 1:15 pm PST). You can read background information on the intraday market reports on the Intraday Market Update page.
Hi Al,
I entered below 8 today (mDT / L2 @MA) and it hit two points but I was holding for a swing (4pts) so I got stopped out on 10 with a lot of slippage. How do you know how to manage your trades. Specifically, how do you determine targets? My entries are good, but it seems I’m not taking profits properly. Either I take them off too soon or I’m swinging when I should be scalping.
Thanks,
Daniel
IMHO, bar 5 is a super strong bull bar so if you’re taking the short at 8, you’d be scalping since there is a high possibility of a 2nd leg up. My target – if I take that short would be near the close / slightly past the high of 4. Let’s see what Al/others say….
thanks Steve for the response
Just another 2 cents; Al suggested looking at the context using both the bull and bear perspective and therefore, if you’re a bull, bar 5 is a strong breakout and if you’re bullish, you’d be willing to try when price gets back down lower especially at the lower 2/3 (as Al often says) in the range.
I admit that I’m struggling with this myself (being “2-sided” in the evaluation) but most of the time, when I make a judgement error, once I “switch on” the lenses of the other side, it’s often pretty clear that I didn’t consider the “other point of view”.
Hi Daniel,
That bar 10 move was not typical, and obviously due to a breaking news snippet, so cannot really base your management strategy on these outliers.
For trade management guidelines watch, or re-watch videos 36A and 36B where Al covers the topic you are referring to. Also the videos on Protective Stops, Swinging and Scalping, and Support & Resistance cover targets and such in great depth.
As far as swinging vs scalping, Al would suggest scalping until it was clearly in a trend. Having said that your 4 point target was Ok given the broad range, so again, I would not fret over an atypical event like bar 10. It moved so fast!
Thanks Rich