Emini and Forex Trading Update:
Thursday August 6, 2020
I will update again at the end of the day.
Pre-Open market analysis
The Emini yesterday closed the February gap at the start of the pandemic crash. The bulls are looking for a reason to take some profits. Closing the gap might do it.
But the 5 month rally tested many resistance levels and broke above every one. Therefore, if yesterday is the start of a selloff, it probably will only last 1 – 3 days. Traders believe there will be buyers in the gap above last week’s high. Furthermore, they think that this rally will make a new high before there is more than a 3 day pullback.
Yesterday was a small day in an overbought market on the daily chart. That lack of buying increases the chances of a profit taking pullback.
With yesterday closing around the open, it is a star doji and a credible sell signal bar for today. The Emini might have to test back into Monday’s gap to see if the bulls can keep the gap open.
Since yesterday had a small range, today could be an outside down or up day. Or, if today gaps down, there would be a one day island top. However, island tops and bottoms are typically minor reversal patterns.
6 consecutive bull days is extreme
While yesterday was a doji, it closed slightly above the open. It was therefore the 6th consecutive bull bar on the daily chart. Because that is getting unusual, it increases the chance of a bear bar today or tomorrow. That will make traders more willing to sell reversals down from above the open, expecting today to close below the open and finally form a bear body on the daily chart.
Overnight Emini Globex trading
The Emini is up 1 point in the Globex market. It will therefore probably open within yesterday’s range. Since yesterday was a trading range and today will open in that range, there is an increased chance of a trading range again today.
However, with yesterday’s range being so small, there is an increased chance that today will trade both above and below yesterday’s range, becoming an outside day. Consequently, there might be seller’s above yesterday’s high and buyers below yesterday’s low.
Because this week’s gap up is important, it is a magnet below. That increases the chance of a bear trend down into that gap.
Also, whenever a market appears to be less likely to do something, it actually is more likely to do it. Everyone sees that the daily chart is overbought and therefore a pullback is likely.
But that increases the chance that the pullback traders are already positioned for a pullback. There might not be enough other traders will to sell. If this is true and the Emini does not go down, the bears will begin to buy and bulls who took profits will also buy. That increases the chance of a big bull trend day, despite an overbought market.
Yesterday’s setups

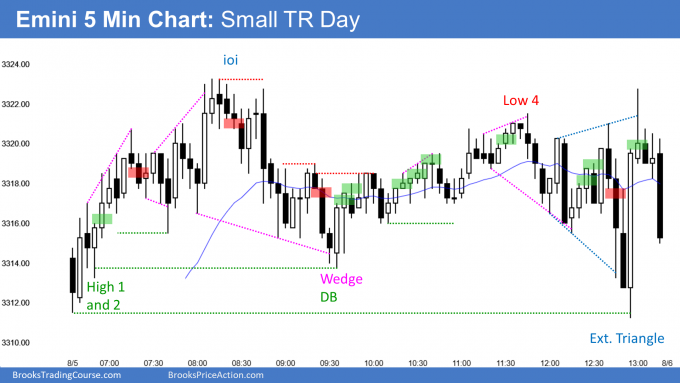
Here are several reasonable stop entry setups from yesterday. I show each buy entry with a green rectangle and each sell entry with a red rectangle. I rarely also show limit order entries and entries on the close of bars. I do not want the lines to be distracting. If they are longer, I make them dotted. But, they have to be visible, so I make the shorter ones solid. Buyers of the Brooks Trading Course and Encyclopedia of Chart Patterns have access to a much more detailed explanation of the swing trades for each day (see Online Course/BTC Daily Setups).
My goal with these charts is to present an Always In perspective. If a trader was trying to be Always In or nearly Always In a position all day, and he was not currently in the market, these entries would be logical times for him to enter.
If the risk is too big for your account, you should wait for trades with less risk or trade an alternative market like the Micro Emini.
EURUSD Forex market trading strategies

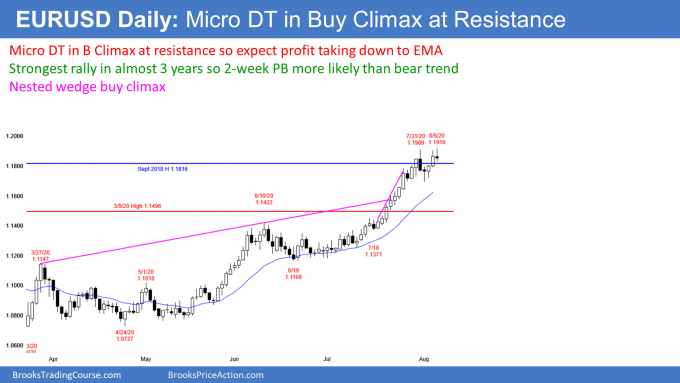
The EURUSD Forex market on the daily chart is forming a micro double top at the resistance of the September 2018 high. It is coming in a nested wedge buy climax.
This should attract profit taking and some shorting. Traders should expect a couple week pullback to around the EMA. It should also test the breakout point of the March 9 high. There is a 30% chance that it could last longer and fall down to the June 9 low.
The bulls hope that the pullback lasts only a few days. The rally from the June 19 low has been a Small Pullback Bull Trend. Every pullback ended after only 1 or 2 days. While that is possible again here, the pattern and the context make a deeper pullback more likely this time.
Overnight EURUSD Forex trading
The 5 minute chart of the EURUSD Forex market broke above last week’s high overnight and then reversed down. The bulls do not want a bear day closing on its low today because that would attract selling and increase the chance of a pullback. They want the trend to continue up indefinitely. Consequently, they will buy selloffs today. They would like today to close above the open so that today would have a bull body on the daily chart. That would increases the chance of another leg up to 1.20 before there is profit taking.
The bears want the EURUSD to go down to support on the daily chart. They will sell rallies and try to get today to close on its low. If they are successful, traders would expect lower prices for at least a couple days and possibly a couple weeks.
What is most likely? While the EURUSD has reversed down from above last week’s high, the selloff has not been particularly strong. It has traded sideways for a few hours around yesterday’s close. This increases the chance that today will continue sideways and either close around the open or near the low, but not far below the current low.
Can today reverse back up to above yesterday’s high? That is unlikely after already reversing down?
Can it break strongly to the downside and become a huge bear day? With it sideways for 5 hours, that also is unlikely. Day traders have been scalping for 5 hours and will continue to scalp unless there is a surprise breakout up or down.
Summary of today’s S&P Emini futures price action and what to expect tomorrow

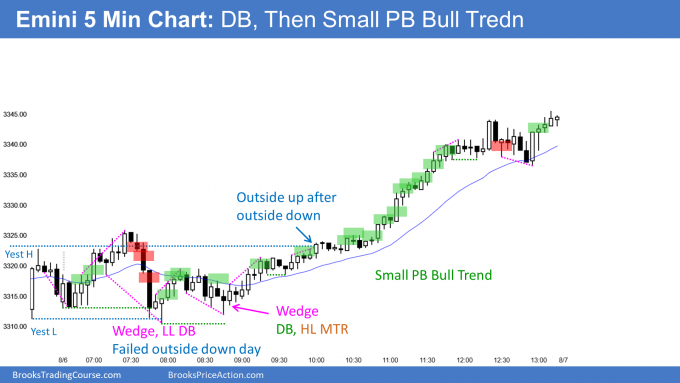
Here are several reasonable stop entry setups for today. I show each buy entry with a green rectangle and each sell entry with a red rectangle. I rarely also show limit order entries and entries on the close of bars. I do not want the lines to be distracting. If they are longer, I make them dotted. But, they have to be visible, so I make the shorter ones solid. Buyers of the Brooks Trading Course and Encyclopedia of Chart Patterns have access to a much more detailed explanation of the swing trades for each day (see Online Course/BTC Daily Setups).
My goal with these charts is to present an Always In perspective. If a trader was trying to be Always In or nearly Always In a position all day, and he was not currently in the market, these entries would be logical times for him to enter.
If the risk is too big for your account, you should wait for trades with less risk or trade an alternative market like the Micro Emini.
End of day summary
I mentioned that today had an increased chance of being an outside day because yesterday was so small. Today reversed down from above yesterday’s high to below its low, becoming an outside down day. It then went back above yesterday’s high to be an outside up day.
I also said that because yesterday was a credible minor top, there was an increased chance of a big bull day. The bulls got a measured move up based on the height of the 4 hour initial trading range.
The bulls want a new all-time high this week. Tomorrow’s unemployment report could be the catalyst.
Because today was a buy climax, there is a 75% chance of at least a couple hours of sideways to down trading tomorrow starting by the end of the 2nd hour.
See the weekly update for a discussion of the price action on the weekly chart and for what to expect going into next week.
Trading Room
Traders can see the end of the day bar-by-bar price action report by signing up for free at BrooksPriceAction.com. I talk about the detailed S&P Emini futures price action real-time throughout the day in the BrooksPriceAction.com trading room. We offer a 2 day free trial.
Charts use Pacific Standard Time
When I mention time, it is USA Pacific Standard Time (the Emini day session opens at 6:30 am PST, and closes at 1:15 pm PST). You can read background information on the intraday market reports on the Market Update page.
Hi Al,
I’ve been looking into trading bond futures. I’m currently trading small on TLT to get the hang of trading bonds in general. The price action in bonds, for me, is pretty straight-forward and I go for a reward that is 2x my risk. I’ve done well trading it live. My thinking is, once I’m comfortable trading around $500+ per trade, it may make sense to trade UB.
I was wondering from your experience, the leap to trade an instrument like UB Futures, is it just a matter of being comfortable trading its tick size? Or are there other factors to keep in mind?
Thanks
By UB, I believe you are referring to the ultra bond futures contract. I personally trade the 30 year bond futures contract. For years, I traded the 10 year.
I have never traded the UB because its chart is almost identical to the 30 year, which makes sense because it is a basket that includes the 30 year. Also, its volume is about the same.
Without having traded it, I assume that it trades very similarly to the 30 year bond futures. For me, I trade bond futures exactly as I do any market.
For years, I traded the 5 minute chart of bonds and notes. Now, I look for patterns on the daily or weekly chart and then take entries based on the 5 and 60 minute charts.
Cool, I’ll check out the 30 year. Thanks!