Emini December stock market crash to monthly bull trend line
I will update again at the end of the day.
Pre-Open market analysis
Monday was the 10th consecutive bear trend bar on the daily chart. This has never happened in the 20 year history of the Emini. It did not even happen in the 50 – 60% selloffs in 2002 and 2008. It is therefore unsustainable. That makes it a sell climax.
It will likely end this week. The bears will sell the 1st bull bar. But, the bulls might get a micro double bottom a day or two later. The Emini will probably soon enter a 200 – 300 point tall trading range for many months.
Stock market crash
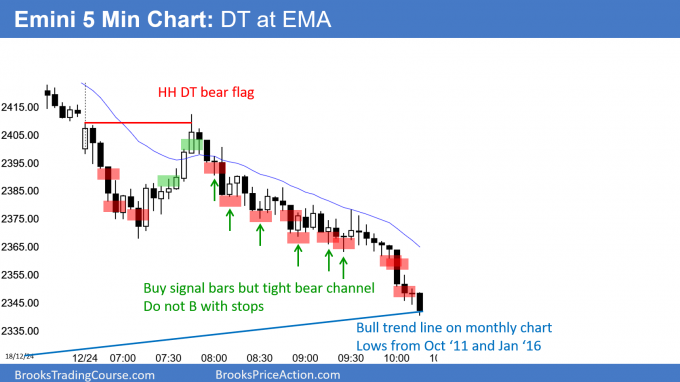
The Emini is crashing on the daily chart. At the end of Monday, it finally dipped below the monthly bull trend line. Most bear markets end at monthly bull trend lines.
But, the momentum down is strong. In addition, there is another monthly bull trend line around 2,100. That is near the top of the 2014 – 2015 trading range. Since 2015, I have been saying that that trading range would probably be the final bull flag.
Furthermore, I said the Emini would probably hit 1,800 within the next 3 – 5 years. Prior to this month, the odds favored a new high before reaching that target. At the moment, there is a 50% chance that this selloff will reach the target before making a new high.
Because the Emini has crashed down to monthly support, the bears will probably begin to take partial profits here. The bulls know that and will start to scale into longs. With both the bears and bulls starting to buy, the Emini could begin a 1 – 2 week bear rally. Traders will look for a reversal up this week. Until there is a clear reversal, they will continue to sell every small rally on the 5 minute chart.
Overnight Emini Globex trading
The Emini is up 20 points in the Globex session. In addition, it reversed up 60 points from an early overnight selloff. Because a 1 – 2 week rally will probably begin this week, there is an increased chance that this is the start.
Friday ended in an extreme sell climax. There is therefore a 75% chance that today will have at least a 2 hour rally or trading range that begins by the end of the 2nd hour. There is a 50% chance of some follow-through selling in the 1st hour. But, the bears only have a 25% chance of another big bear trend day today.
The bulls will look for a swing up today. While the bears hope for another bear trend day, they know that the daily chart is in an extreme sell climax and that the monthly chart is below its bull trend line. Consequently, many bears will begin to take profits and wait to sell again near resistance on the daily chart. This reduces the chance of another big bear day.
Because the ranges have been huge, both the bulls and bears will probably have swing trades every day. However, the number and size of the bull swings will probably begin to get bigger than the bear swings.
The week between Christmas and New Year’s is usually the quietest of the year. However, this is relative. A quiet week after days that are 50 points tall could still have many days that are 30 – 50 points tall. Consequently, instead of lots of tight trading range trading, which is typical of this time of year, traders will probably still have many swing trades up and down.
Monday’s setups
Here are several reasonable stop entry setups from Monday. I show each buy entry with a green rectangle and each sell entry with a red rectangle. I rarely also show limit order entries and entries on the close of bars. My goal with these charts is to present an Always In perspective. If a trader was trying to be Always In or nearly Always In a position all day, and he was not currently in the market, these entries would be logical times for him to enter.
EURUSD Forex market in tight trading range at apex of wedge
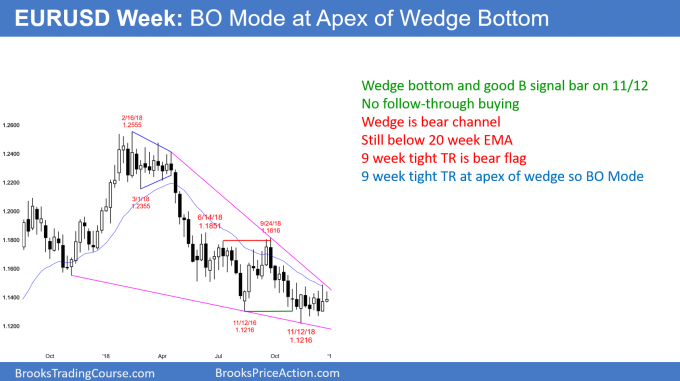
The EURUSD weekly Forex chart has been in a tight trading range below the 20 week EMA for 9 weeks. In addition, it is at the apex of a wedge bottom. It is therefore in Breakout Mode.
The EURUSD weekly Forex chart is in a tight trading range, which is a Breakout Mode pattern. It is also at the apex of a wedge bottom, which is another Breakout Mode pattern. When there is a Breakout Mode pattern, there is a 50% chance that the 1st breakout up or down will fail. In addition, the probability of a bull or bear breakout is 50%.
Until there is a breakout, there is no breakout. Traders buy low, sell high, and take quick profits. As a result, as any bar is forming, the odds are greater that the pattern will continue to add more bars than break out.
Overnight EURUSD Forex trading
The EURUSD 5 minute Forex chart has been in a 20 pip range for the past 5 hours. That is so tight that scalpers have a difficult time making money.
The week between Christmas and New Year’s is typically the quietest of the year. However, Forex markets often break out in early January. Therefore, day traders are ready for a breakout in the coming days.
Summary of today’s S&P Emini futures price action and what to expect tomorrow
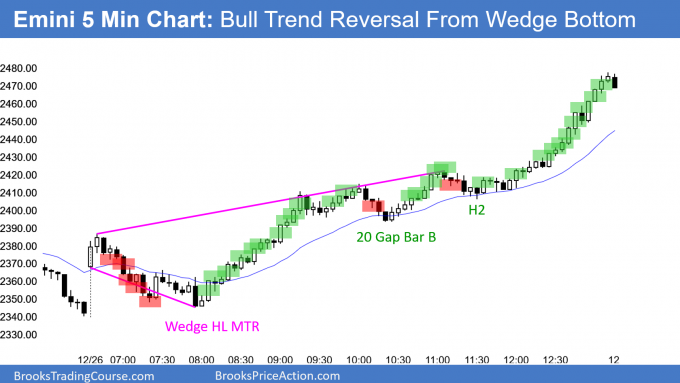
Here are several reasonable stop entry setups for today. I show each buy entry with a green rectangle and each sell entry with a red rectangle. I rarely also show limit order entries and entries on the close of bars. My goal with these charts is to present an Always In perspective. If a trader was trying to be Always In or nearly Always In a position all day, and he was not currently in the market, these entries would be logical times for him to enter.
After a wedge selloff that tested Monday’s low, the bulls got a strong rally to above the 60 minute EMA. The open of the week is probably going to be the key price for the remainder of the week. This is because the bears want a bear bar after last week’s breakout below a 50 bar trading range. If the bulls instead get a bull bar, traders will begin to wonder if the bear breakout was a trap. If would increase the chance of a big rally over the next couple of weeks.
Since today closed near its high, it is a buy signal bar for tomorrow. The bulls want a strong reversal up from the monthly bull trend line. However, more likely, the 1st reversal up will be minor. But, at a minimum, it should test Friday’s high and 2,500 within a couple weeks.
Today was a FOMO (Fear Of Missing Out) short covering rally. It formed a Bull Surprise Bar on the daily chart. The odds favor at least 2 small legs sideways to up.
See the weekly update for a discussion of the price action on the weekly candlestick chart and for what to expect going into next week.
Trading Room
Traders can see the end of the day bar-by-bar price action report by signing up for free at BrooksPriceAction.com. I talk about the detailed S&P Emini futures price action real-time throughout the day in the BrooksPriceAction.com trading room. We offer a 2 day free trial.
Charts use Pacific Standard Time
When I mention time, it is USA Pacific Standard Time (the Emini day session opens at 6:30 am PST, and closes at 1:15 pm PST). You can read background information on the intraday market reports on the Intraday Market Update page.


Hi Al, at the close of #17, I thought the probability is high that it will go at least a little lower for a scalping because it is such a good looking bear bar (and clearly always in short, and below 20MA, and context is in strong bear trend, everything looks good…), traders equation looks ok to me.. Obviously it turns out to be a bad trade. I am wondering what is my mistake here? If one must short here, do you think it is better to sell below #17 instead of the close of #17?
My concern at that point was that the bulls might form a wedge bottom. In the chat room, I said many times that the odds favored a bull day and that therefore there would likely be a reversal up. I agree that the bar was good for the bears, but there was a 50% chance it would be a trap. If a trader sold, he would exit above the bull bar 18. Bulls would buy the wedge reversal or above the bigger next bull bar.
In general, it is better to sell with a stop below bear bars closing near their lows instead of on the close. This is because many bulls will buy the close of a big bear bar, betting on a bear trap.
Thank you Al, this is very helpful information, as always!
Hi Al, I would like to give you my condolences for your mom.
The question that I have is how do you know about the first or second hour of trading and then the direction the market is taking.
Today was unusually easy. You can read today’s post. Also, I talked about it in the chat room. Beyond that, I assume that the probability of the 1st swing is 50% for the bulls and bears. Most days have either a double bottom, a wedge bottom, a double top, or a wedge top in the 1st 90 minutes. I look for one to form and then trade it. Most days require more than one entry before a swing begins. If you bought access to my collection of over 2,000 examples (https://www.brookstradingcourse.com/brooks-encyclopedia-chart-patterns-sampler/), you can more easily see what I expect to find every day.
Hi Al,
when there is a strong buy SB for a MRV in a bear trend ( like today );
do you buy for scalp ?
or will you wait for a micro DB before you buy ?
or wait to use LO to buy below the strong buy SB ?
Thanks !
In the 1st hour in the chat room today, I said that I was buying calls because the Emini has never had 10 consecutive bear days and a rally was therefore likely. I said many times during the day that I was continuing to hold. In the final minutes, I took part off. I also said that this rally will probably have a couple legs up over the next 1 – 2 weeks, and it will probably test sell climax highs, like Friday’s high or last Wednesday’s high, as well as the 20 day EMA. I said that my goal is to hold at least part of the position up to the targets, as long as the rally continues.
Finally, I said that the nature of today’s rally was different from the other rallies since the September high. This was the 1st clear FOMO (Fear Of Missing Out) rally. Traders were not waiting to buy pullbacks. The bears were afraid and were buying back shorts. The bulls were confident of 2 legs up and bought at the high all day long. They were not waiting for a pullback because it might not come until the rally goes up much further.
The difficulty for many traders will be the risk. The stop for longs is now far below. Some traders will buy small and add on lower, betting on at either a bear rally or a trading range for the next several weeks. Others will wait for a pullback. Their risk is that it might not come for another few days and they will miss 50 – 100 points more in the current rally.
The important points are that the odds favor at least 2 legs up and a test down to around last week’s low. But, that test might not come for a few weeks. Also, it might have 2 – 3 small legs down.
Today was the clear day. Since a sell climax typically leads to a trading range, the price action will probably be murky starting within a few days. But, the odds are that there will be at least a small 2nd leg up.