Emini and Forex Trading Update:
Friday March 6, 2020
I will update again at the end of the day.
Pre-Open market analysis
The Emini sold off again yesterday to below the 3000 Big Round Number. But Wednesday had a bull body on the daily chart. It was therefore a weak sell signal bar. That increases the chance that there might be more buyers than sellers below its low. We will find out today.
Although the Emini will open with a big gap down, the odds are against a big bear day today. It will open around the open of the week on the Globex chart. This week is now a big doji inside bar on the weekly chart. The open might be a magnet today. If so, today could be a trading range day that oscillates around the open of the week.
Also, the overnight low is near last week’s low. The Emini rallied strongly from that low last Friday. It is therefore support. There will probably be enough buyers around that low again to prevent a big bear day.
Importance of Friday’s close
Today is Friday. The week is so far an inside bar on the weekly chart. It is therefore a Low 1 sell signal bar. It would be more bearish if it closes on its low and has a bear body. Therefore, the bears will try to get the week to close on the low. That would increase the chance of lower prices next week.
If the bulls create a big bull trend day today, traders would see today as forming a double bottom with last week’s low on the daily chart. That would increase the chance of a reversal up again next week. The bulls might then be able to prolong the trading range. But the odds still favor a 2nd leg down whether or not the bulls can get a reversal up for another week or two.
Overnight Emini Globex trading
The Emini is down 90 points in the Globex session. A big gap down only has a 20% chance of a big bear trend from the open.
If today is to continue down to below last week’s low today, the bears will probably want to sell closer to the average price. Consequently, there is an increased chance of a trading range open for the 1st hour or two. Once the Emini gets closer to the EMA, the bears will look to sell a double top or a wedge rally.
The Emini is opening near last week’s low. It rallied strongly last Friday from this level. Therefore, there is an increased chance that the bulls will buy aggressively again early today. Traders will watch for a possible strong early rally. If there is one, today could be Bull Trend From The Open type of day. Today might then form a double bottom with last week’s low. If so, it could postpone the break to lower prices for a few weeks.
Yesterday’s setups

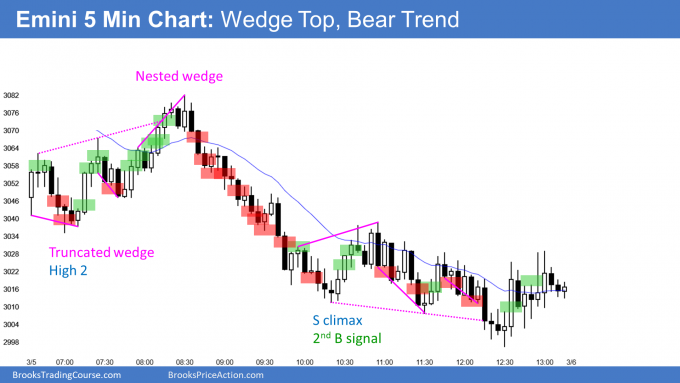
Here are several reasonable stop entry setups from yesterday. I show each buy entry with a green rectangle and each sell entry with a red rectangle. I rarely also show limit order entries and entries on the close of bars. Buyers of the Brooks Trading Course and Encyclopedia of Chart Patterns have access to a much more detailed explanation of the swing trades for each day.
My goal with these charts is to present an Always In perspective. If a trader was trying to be Always In or nearly Always In a position all day, and he was not currently in the market, these entries would be logical times for him to enter.
If the risk is too big for your account, you should wait for trades with less risk or trade an alternative market like the Micro Emini.
EURUSD Forex market trading strategies

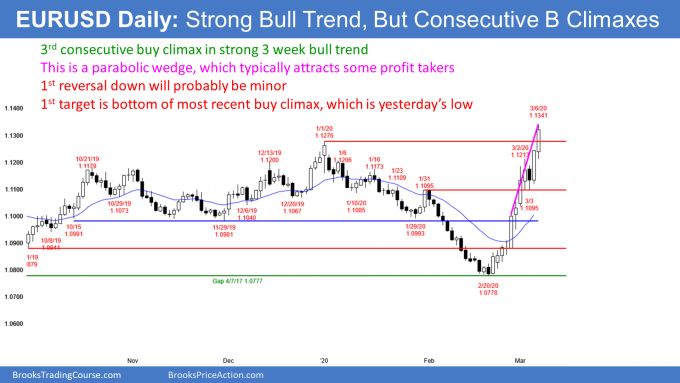
The daily chart of the EURUSD Forex market has rallied strongly for 3 weeks. It is now in a bull trend. Traders will buy the selloff, even if it retraces half of the rally.
The rally has had 3 surges. That is a parabolic wedge buy climax. The stop for the bulls is now far below. That means the risk is big. Traders can reduce their risk by reducing their position size. A parabolic wedge buy climax typically attracts some profit takers. If the bulls take profits next week, the 1st target is the bottom of the most recent buy climax. That is yesterday’s low.
Can this trend continue up strongly like this next week? Probably not. There will probably be enough traders taking profits to create at least a small pullback within a few days.
Overnight EURUSD Forex trading
The 5 minute chart of the EURUSD Forex market rallied strongly again overnight. However, it has been in a 20 pip trading range for 3 hours. Also, the day’s range is about as big as the other 3 very big days in the 3 week rally. It therefore will probably not get much bigger. That reduces the chance of a big rally from here today. If there is a new high, the 3 hour trading range will probably be the Final Bull Flag. That means the rally will likely pull back into the trading range by the end of the day.
What about the bears today? They have not made money overnight. When a bull trend is strong, it is better to only buy. In general, it is difficult to make money as a bear until there has been at least one 30 pip pullback. Most bears should wait.
If there is a break above this 3 hour range and then a reversal down, the bears will sell for a Final Bull Flag reversal. But the odds of a big move down are small. Traders expect today to be mostly sideways for the remainder of the session.
Summary of today’s S&P Emini futures price action and what to expect tomorrow

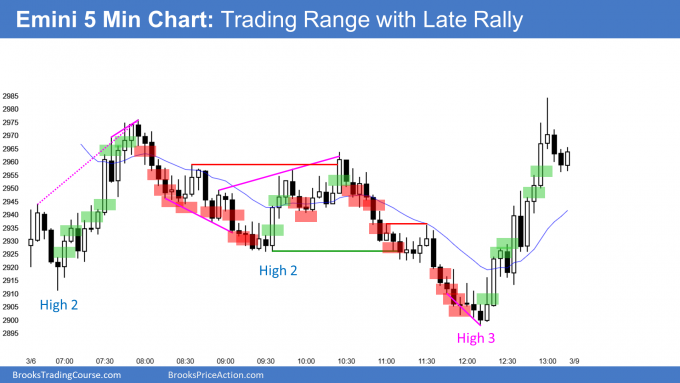
Here are several reasonable stop entry setups for today. I show each buy entry with a green rectangle and each sell entry with a red rectangle. I rarely also show limit order entries and entries on the close of bars. Buyers of the Brooks Trading Course and Encyclopedia of Chart Patterns have access to a much more detailed explanation of the swing trades for each day.
My goal with these charts is to present an Always In perspective. If a trader was trying to be Always In or nearly Always In a position all day, and he was not currently in the market, these entries would be logical times for him to enter.
If the risk is too big for your account, you should wait for trades with less risk or trade an alternative market like the Micro Emini.
End of day summary
Today was a trading range day on the 5 minute chart, but it reversed up strongly at the end of the day. It closed near the high and formed a bull reversal bar on the daily chart.
The bulls want a double bottom reversal up on the daily chart with last Friday’s low. But today is a relatively small bar with a prominent tail on top. It is therefore not a particularly strong buy signal bar for Monday.
Furthermore, the odds still favor an eventual move down below last week’s low within a few weeks. This is true even if the bulls get a rally for a couple weeks.
Traders are deciding if the selloff has adequately discounted the coronavirus outbreak. They will probably need more time before concluding that the outbreak will not get much more serious. This could result is a continuation of the week-long trading range.
Today was the end of the week. This week was a bear doji candlestick on the weekly chart. A doji bar is a 1 bar trading range and a sign of a balance market. It is a weak sell signal bar for next week.
See the weekly update for a discussion of the price action on the weekly chart and for what to expect going into next week.
Trading Room
Traders can see the end of the day bar-by-bar price action report by signing up for free at BrooksPriceAction.com. I talk about the detailed S&P Emini futures price action real-time throughout the day in the BrooksPriceAction.com trading room. We offer a 2 day free trial.
Charts use Pacific Standard Time
When I mention time, it is USA Pacific Standard Time (the Emini day session opens at 6:30 am PST, and closes at 1:15 pm PST). You can read background information on the intraday market reports on the Market Update page.
Hi Al,
I know that you do not use globex chart but use cash session chart for analysis. Could you explain more on why not using a globex chart? (apologies if you have mentioned in you teaching video cause I have not finished them yet)
Also will there be different why of interpretation if using a globex chart? How should we deal with it?
Thank you!
I believe Al always answers this question in this sense: You simply pick one type of chart and stick with it – doesn’t matter which one. No difference between globex chart and day session, you trade them the exactly the same way. Al likes to use the day session.
Yes. I heard Al said this before but I am so curious to know if he has any reason trading simply on day session chart. I feel like day session will be much more influenced by the stock market trading but globex will be affected by other markets. But I would be grateful if he could say something more about his choice.
You are right! Al has said several times in webinars and elsewhere that his main reason for trading the day session is that he likes to be in sync with the stock market traders and cash index.
Al talks on topic in his “My Setup” article in the How To Trade Manual. Al makes it clear that it’s a personal choice and trading the Globex is fine too.
This is slightly out of context, but is the day session chart available on Tradingview? Am able to find the globex chart but not the cash session chart. Am not from US and currently trying Trading emini CFD on a forex broker’s demo account, which only provides globex charts, but I’d like to trade in the cash session’s timings and hence would like to see where the EMA is, if I can find such a chart on tradingview then I can use that and trade on the demo account.
Wanna use the cash session charts because then I can apply a lot of patterns that AL talks about for day trading.
I also cannot find emini day session only on tr view. So i use spy.
Thanks, that’s a good idea, although getting day session chart on TV would have been the best option but SPY would do for now.
why bar 3 is not a short entry? Thanks!
I would say too far below MA (not a good location to sell well below average price), also tail at the bottom of the bar, not a good signal bar. Also following a pair of decent bull bars, bar 2 with a good size body. Not sure if i’m reading this correctly, but i was personally looking to go long on the open, thinking MA or yesterday’s low as a target.
Bar 3 is not a great sell signal bar that far below the moving average and following two bull bars, one of which closed near its high. Better to wait for a double top or wedge closer to the moving average.