Emini and Forex Trading Update:
Friday July 26, 2019
I will update again at the end of the day.
Pre-Open market analysis
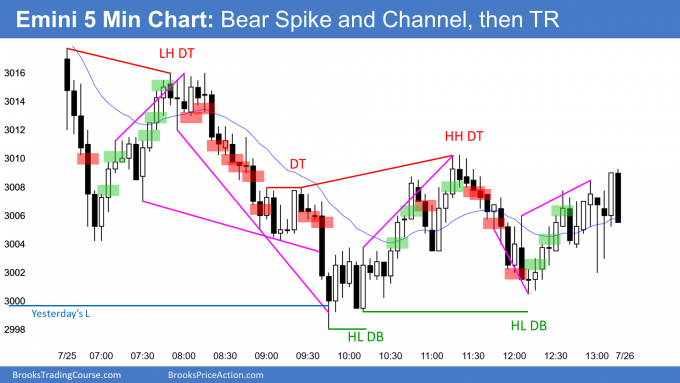
The Emini repeated its pattern from last week of strongly reversing trend days. Yesterday totally reversed Wednesday’s rally. Yesterday now is a double top with last week’s high.
Nothing has changed. The month-long wedge rally and the several big bear bars are telling traders that the Emini will probably go down for a few weeks. This is true even if it goes a little higher.
Logical targets are the higher lows in the wedge rally. That means around 2900 – 2900.
There is always a bull case. The bulls have a 40% chance of a big rally from here without a 2 – 3 week pullback first.
Next week’s FOMC meeting is unusually important. The Emini might stay sideways until then.
Overnight Emini Globex trading
The Emini is up 7 points in the Globex session. Yesterday formed a higher low major trend reversal on the 5 minute chart. The pattern was also a head and shoulders bottom.
Today will probably open above the neck line. This will trigger the buy signal. Every major trend reversal pattern has a 40% chance of leading to a trend.
However, the daily chart has been in a tight trading range for 4 weeks. Yesterday was in a trading range. Trading range price action is more common than trends. Finally, traders might want to remain neutral ahead of next Wednesday’s important FOMC announcement. Consequently, today will probably not be a strong trend day.
Since today is Friday, weekly support and resistance can be important, especially in the last hour. The bulls want the week to close near its high and possibly at a new all-time high. Since the week’s low is far below, the best the bears can reasonably expect is a close below the midpoint of the week.
Yesterday’s setups

Here are several reasonable stop entry setups from yesterday. I show each buy entry with a green rectangle and each sell entry with a red rectangle. I rarely also show limit order entries and entries on the close of bars. Buyers of the Brooks Trading Course and Encyclopedia of Chart Patterns have access to a much more detailed explanation of the swing trades for each day.
My goal with these charts is to present an Always In perspective. If a trader was trying to be Always In or nearly Always In a position all day, and he was not currently in the market, these entries would be logical times for him to enter.
EURUSD Forex market trading strategies

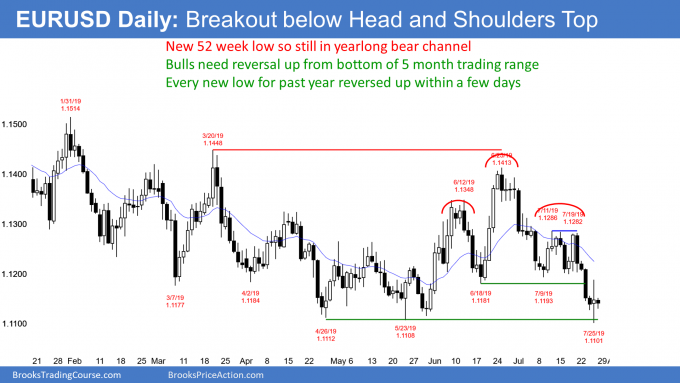
The EURUSD daily Forex chart broke to a new 52 week low yesterday. It is therefore still in its yearlong bear channel. However, every new low over the past year reversed up for 2 – 3 weeks within a few days. In addition, there is also a 5 month trading range and most trading range breakouts fail.
In addition, yesterday closed above the May low and above the open of the day. The chance of a successful bear breakout would have been greater if yesterday was a big bear bar closing on its low and far below the May low.
Consequently, this breakout so far looks like every prior new low in the bear channel. Traders will expect it to fail and for there to be a 2 – 3 week rally staring within a week.
Bear channels can last a long time but not forever. There is a 75% chance of an eventual bull breakout and only a 25% chance of a strong bear breakout with a conversion into a stronger bear trend. Since yesterday was a big doji day, which is neutral, traders need more information. They might be waiting for Wednesday’s FOMC Fed rate cut announcement before deciding on the direction of the next few weeks.
ioi Breakout Mode pattern
Today so far is a small day and it is also at yesterday’s open and close. An inside day after an outside day is an ioi Breakout Mode setup (inside-outside-inside, since the day before an outside day is inside of that outside day). Today will therefore be both a buy and a sell signal bar for Monday. Unless the bears begin to get a series on big bear days closing on their lows, the odds favor higher prices for at least a couple weeks.
Overnight EURUSD Forex trading
The EURUSD 5 minute Forex chart has been in a 20 pip range overnight. It is in the middle of yesterday’s range. Yesterday was a big doji bar on the daily chart with an open and close almost in the exact middle. Today is a continuation of that neutrality.
If today remains small, day traders will look for 10 pip scalps. Also, after yesterday’s big reversals, they will expect any 30 – 50 pip today move up or down to reverse.
Summary of today’s S&P Emini futures price action and what to expect tomorrow

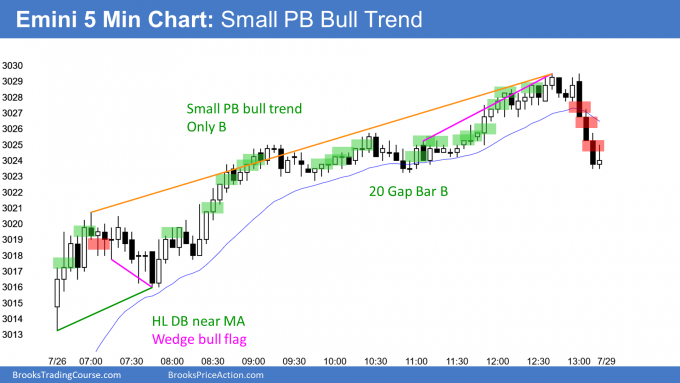
Here are several reasonable stop entry setups for today. I show each buy entry with a green rectangle and each sell entry with a red rectangle. I rarely also show limit order entries and entries on the close of bars. Buyers of the Brooks Trading Course and Encyclopedia of Chart Patterns have access to a much more detailed explanation of the swing trades for each day.
My goal with these charts is to present an Always In perspective. If a trader was trying to be Always In or nearly Always In a position all day, and he was not currently in the market, these entries would be logical times for him to enter.
End of day summary
After a quiet open, the Emini rallied in a Small Pullback Bull Trend to a new all-time high. While there is no top yet, the rally is a buy climax on the daily and weekly charts. Consequently, traders expect a 2- 3 week pullback beginning within a couple weeks. Next Wednesday’s FOMC announcement is a possible catalyst.
See the weekly update for a discussion of the price action on the weekly chart and for what to expect going into next week.
Trading Room
Traders can see the end of the day bar-by-bar price action report by signing up for free at BrooksPriceAction.com. I talk about the detailed S&P Emini futures price action real-time throughout the day in the BrooksPriceAction.com trading room. We offer a 2 day free trial.
Charts use Pacific Standard Time
When I mention time, it is USA Pacific Standard Time (the Emini day session opens at 6:30 am PST, and closes at 1:15 pm PST). You can read background information on the intraday market reports on the Intraday Market Update page.
Hi Al,
20 was a L2 reversal bar closing on its low tick, with the L1 at 18 being the same. These bars were at the top of a trading range as well. I figured selling below 20 would’ve been reasonable. Why not? Is it because of the strong gap up holding above the ema?
Thank you
There was not impressive selling pressure on the decline from 6 to 15. It looked more like a leg in a trading range (which it was) than the start of a bear trend but the trading range was too small to enter on a stop. Besides the gap up buying pressure, the bears could not even touch let alone close below the EMA. The breakout of the trading range above 23 or 25 was the trade of the day to me.
I was thinking to short below 20 too, just did not take this trade casue I seriously doubt about the reversal. If you took this sell, and put your protective stop above HOD, on 22 H, you would have been lost out. even if you waited until the close of 22, it was a H1 above EMA20, just close your position without a second thought. OK to lose this one I guess. If I took this trade, I would PRB lose with my stop being hit.
The reason I did not take the stop below 20 was because I took the sell-the-close when 6 was forming on 3min chart. I sold a bear close on 3min chart for an early entry and was tortured all the way down to the 3min ema20 and watched the buyers swarming into the discount buy. I took a small profit out and basically forget about to short for the rest of the day……
Thanks for all of your feedback, it’s always appreciated! Xiaoxiao, cool to know that you also watch the 3m chart. I watch that probably more than the 5m these days and I love it. It seems to be a great balance of higher frequency opportunities as opposed to the 1m chart that are more likely to fail under the weight of the 5m chart bigger picture, as well as entrances and exits that are cleaner in comparison to the 5m. When I say this I mean, for example, having a strong bull bar for a buy signal bar (or the opposite for sell) when on the 5m chart, you might have a bad signal bar that is even a bear bar. Usually when there’s a good setup on the 5m chart, the 3 already showed it and it was possibly even cleaner. Also since 3m candles are smaller, they present 1:1 and 2:1 ratios based on the signal bar more often. This is just what I’ve noticed personally.
Yes, I agree with you. I usually use 3min chart on spike phase to find an H1 or L1 signal which is sometimes clearer or earlier than that is on 5min. For example, if I sense the 5min chart might be forming a big spike bar (trend bar) and the context looks right (morning big gap open something like that), I will switch to 3min chart and prepare to enter the trend. The risk sometimes easier to control and smaller. I am still working on this, so just share my two cents…
The Emini does something 60% of the time early in a good trade that makes you question the trade. It is testing the resolve of the bulls.
Here, the buy setup was a higher low double bottom near the MA after a gap up, and the 2nd leg down was a wedge. That is a reliable and common pattern. When you add the consecutive outside bars, the probability was better.
While it’s reasonable to take the Low 2 short, it was more likely a pullback early in a Small Pullback Bull Trend and therefore a trap. It trapped weak bulls out and weak bears in. Weak bears are afraid of loss. They are drawn to small sell signal bars like bugs with those blue zapper lights on your patio.
It’s one of those diving board trades that I sometimes mention. You jump off the high board as a kid, grab you knees and become a ball, tighten every muscle, squeeze your eyes shut, pinch your nose, hold your breath, and hope that the terror will be brief. You soon are safe.
I guess I am one of the weak bears…..
haha, thank you AL.
Thank you Al, great insight as always.