Trading Update: Wednesday July 28, 2021
Emini pre-open market analysis
Emini daily chart
- Yesterday was a bear day after a strong 5-day rally to a new high.
- There is now a reversal down from an expanding triangle top. That is a major trend reversal pattern.
- When the context and sell signal bar are good, there is a 40% chance of a swing down and a 30% chance of a bear trend.
- Here, Monday was the sell signal bar and it was a bull bar. That is a bad sell signal bar.
- Also, this is the 1st reversal down after 5 bull days. That is bad context.
- Finally, yesterday closed above its middle, and it was therefore a weak entry bar.
- So far, this a weak reversal attempt. The bears will probably need at least a micro double top before they will have a 40% chance of more than a 3-day pullback.
- Yesterday is a High 1 buy signal bar, but it had a bear body. That is a low probability buy signal.
- Not a good buy signal and not a good reversal down increases the chance of more sideways.
Emini 5-minute chart and what to expect today
- Emini is up 6 points in the overnight Globex session.
- There is an FOMC announcement today at 11 am PT. Day traders should exit their positions ahead of the report.
- There is usually a big, fast move in both directions in the 1st few minutes after the report. Therefore, day traders should wait at least 10 minutes before resuming trading.
- Day traders should be open to anything after the report. There can be a trend in either direction, and it can be strong or weak. There also can be a trend reversal. Least likely is that there will be no significant reaction and the Emini will enter a trading range.
- Traders should trade today as if there are 2 separate sessions. What takes place after the report has very little correlation with what happens prior to the report.
- Ahead of the report, the bears want strong follow-through selling. But after 5 strong bull days, a 2nd strong bear day is unlikely.
- The bulls want a rally to reverse yesterday’s selloff.
- A strong bear trend is unlikely ahead of the 11 am PT report.
- The report creates uncertainty. That increases the chance of trading range trading.
- It also increases the chance of at least a minor reversal if there is a trend on the open.
Yesterday’s Emini setups

Here are several reasonable stop entry setups from yesterday. I show each buy entry with a green rectangle and each sell entry with a red rectangle. Buyers of both the Brooks Trading Course and Encyclopedia of Chart Patterns have access to a much more detailed explanation of the swing trades for each day (see Online Course/BTC Daily Setups).
My goal with these charts is to present an Always In perspective. If a trader was trying to be Always In or nearly Always In a position all day, and he was not currently in the market, these entries would be logical times for him to enter. These therefore are swing entries.
It is important to understand that most swing setups do not lead to swing trades. As soon as traders are disappointed, many exit. Those who exit prefer to get out with a small profit (scalp), but often have to exit with a small loss.
If the risk is too big for your account, you should wait for trades with less risk or trade an alternative market like the Micro Emini.
EURUSD Forex market trading strategies
EURUSD Forex daily chart

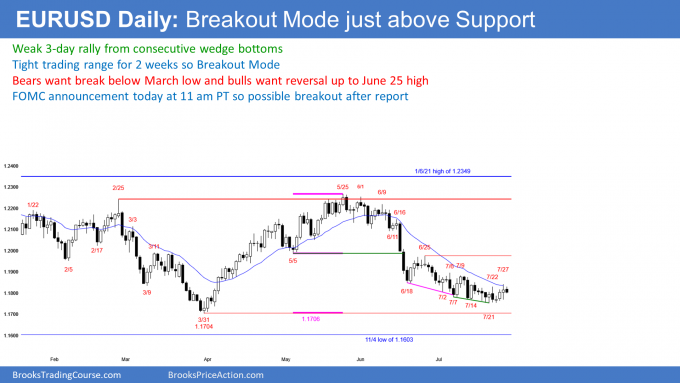
- Three consecutive bull bars after consecutive wedge bottoms. This increases the chance that a reversal up over the next couple of weeks has begun.
- The bulls need to break strongly above the 20-day EMA to convince traders that the July low will hold through August and that the rally can reach the June 25 lower high.
- Yesterday was only a doji bar and the rally stalled at the 20-day EMA and the top of the 2-week tight trading range.
- The daily chart is in Breakout Mode. The bulls want a rally to the June 25 high.
- The bears want a breakout below the March and November lows at the bottom of the yearlong trading range.
- This week broke above last week’s high on the weekly chart. There is now a higher low double bottom with the March low.
- However, there have been 9 consecutive weeks on the weekly chart where every high has been below the high of the prior bar. That bear micro channel is a sign of relentless selling.
- Consequently, the rally on the daily chart will probably not continue up for more than a few weeks. If it reaches the June 25 high, there will likely be about a 50% retracement from there.
- There is an FOMC announcement today at 11 am PT. It can affect all financial markets. Therefore, EURUSD day traders should exit positions ahead of the announcement.
- Furthermore, there is often a big move in both directions immediately after the report. Consequently, day traders should wait at least 10 minutes after the report before resuming trading.
Summary of today’s S&P Emini futures price action and what to expect tomorrow

End of day summary
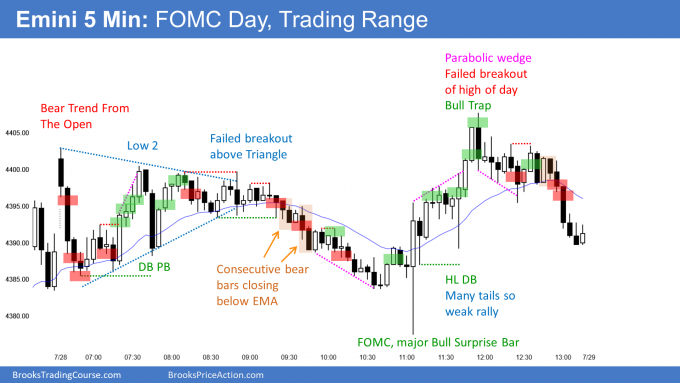
- Sold off from above yesterday’s high, but bounced from a small double bottom at the EMA.
- Entered a trading range, which was a triangle.
- Failed bull breakout and then weak selloff into 11 am PT FOMC announcement.
- Major Bull Surprise Bar on the announcement so either trading range or bull trend was likely for rest of day.
- A weak rally reversed down from a new high, and today was a trading range day.
- The Emini has been stuck at 4,400 for 4 days.
- It has oscillated around the open of the week all week, which is near the 4,400 Big Round Number.
- July ends on Friday and it will probably be the 6th consecutive bull bar on the monthly chart. That has not happened in 10 years, and it makes a bear bar likely in August.
- If August is a bear bar, it will probably be the start of a 2 – 3-month pullback of 15 – 20%,
See the weekly update for a discussion of the price action on the weekly chart and for what to expect going into next week.
Trading Room
Traders can see the end of the day bar-by-bar price action report by signing up for free at BrooksPriceAction.com. I talk about the detailed S&P Emini futures price action real-time throughout the day in the BrooksPriceAction.com trading room. We offer a 2 day free trial.
Charts use Pacific Time
When I mention time, it is USA Pacific Time. The Emini day session charts begin at 6:30 am PT and end at 1:15 pm PT which is 15 minutes after the NYSE closes. You can read background information on the market reports on the Market Update page.


Hello Al. If you could clarify something for me please – you said in your book(and probably in the course as well) to trade the charts and not the news. However, you provided a guideline to exit daytrades before the FOMC announcement. Why is that? Is that specifically for beginners(to protect themselves from losing money) or does someone as experienced as you also exit your trades before the FOMC meet? If so, why?
Thanks and kind regards,
Abir
Exiting before a catalyst is not trading the news. It’s avoiding a situation where it is very difficult to make money.
If a trader holds through 10 consecutive FOMC announcements, he will probably discover that he did not make any money. He’d win some and lose some. It is a 50-50 event, and the bars are big so the risk is big.
The goal is to make money, not just make trades. It is better to only take trades when a trader can structure a trade with a positive Trader’s Equation.
The stop would have to be 20 – 50 points going into an FOMC announcement, which effectively means that a trader is probably better not using any stop. Since there is usually a quick move in both directions, it is better to be a limit order trader. Most traders will lose money with limit orders.
Big bars mean fast moves. Most traders cannot think fast enough to make good decisions.
The math is bad and therefore traders should wait.
Thank you very much for your response, Al. I’ll finish the course first before I start asking questions I guess, that would clear things up more for me.
I find myself hesitating selling below say a strong bear bar right at the open, and even after good strong follow through fearing one or two strong reversals at the open. However, I often see it marked up in your charts and they’re usually profitable trades. What are the guidelines for taking such with-trend trades right after the first bar BO? Are they based on the opening gap and distance from the EMA?
When things are unclear, it is better to wait for consecutive bars in one direction. If the 1st bar is a strong bear reversal bar far up above yesterday’s close and at resistance (it closes near its low and has a good body), it is a reasonable sell signal bar. The opposite is true for a strong bull bar reversing up from support far below yesterday’s close.
Thanks