Emini follow-through buying after consecutive outside day
I will update again at the end of the day.
Thursday was an outside up day after an outside down day on Wednesday. It was therefore a buy signal bar. Friday was the entry bar on the daily chart, and it provided reasonable follow-through buying. This increases the odds of a new all-time high within a couple of months. It might even come this week.
The bears need to create strong bear days before traders will believe that they are back in control. The odds favor higher prices.
Pre-Open market analysis
The Emini is down 1 point in the Globex market. The market only rarely has 3 consecutive strong trend days. It has been in a tight channel for 2 days. Ninety percent of tight channels end by the end of the 3rd day. They end by converting into a trading range for about 10 bars on the 60 minute chart. That is about a day and a half. Therefore, the odds favor more trading range trading today and certainly by the end of tomorrow.
Consequently, day traders expect a 10 point selloff today or tomorrow. But, the 2 day rally was strong. Day traders will buy every 10 – 20 point reversal attempt, expecting a new high within a day or two.
Overnight Emini Globex trading
Friday’s setups
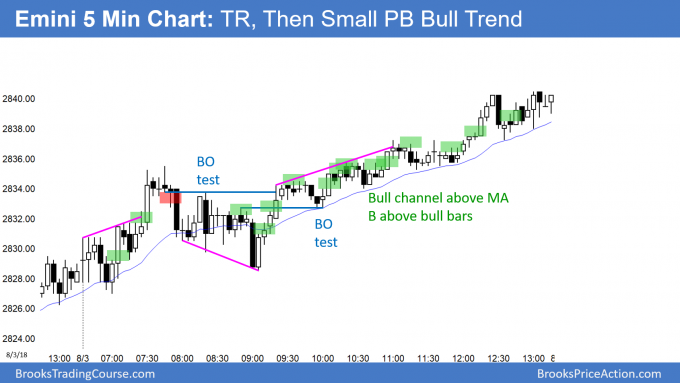
Here are several reasonable stop entry setups from Friday. I sometimes also show limit order entries and entries on the close of bars. My goal with these charts is to present an Always In perspective. If a trader was trying to be Always In or nearly Always In a position all day, and he was not in a position at the moment, these entries would be logical times for him to enter.
EURUSD Forex has 5 consecutive bear trend days
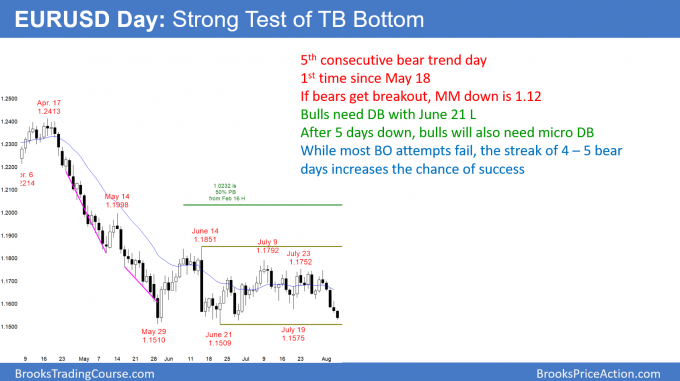
The EURUSD daily Forex chart has a bear trend day so far today today. If it remains a bear day, it will create the 1st streak of 5 consecutive bear days since May 18. Even if it does not, there have not been 4 consecutive trend days up or down in the entire 3 month trading range. This increases the chances of a successful bear breakout.
The EURUSD daily Forex chart had its 4th consecutive bear trend day on Friday. This is the 1st streak of 4 trend days up or down in the entire 3 month trading range. So far, today is another bear trend day. The last streak of 5 consecutive trend days up or down came during the May collapse.
All trading ranges eventually breakout, even though most attempts lead to reversals and a continuation of the range. This breakout attempt is different. Whenever a trading range begins to have a streak of 4 or 5 consecutive trend days up or down, the odds are that a successful breakout is about to happen. Here, the bear days are a sign of sustained selling pressure. Therefore, traders should expect a break below 1.15 within the next week. This is true even if there is a 100 pip reversal up to around the 20 day EMA 1st. Therefore, traders will sell rallies.
Furthermore, traders will look for the selloff to fall for about a measured move down. Since the 3 month range is about 300 pips tall, traders will look for the move to reach around 1.12 over the next few months. Unless the bulls create a very strong reversal up before then, the odds are that the bear trend is resuming.
Overnight EURUSD Forex trading
The EURUSD 5 minute Forex chart sold off 40 pips overnight. While the past 5 days have not been big bear days, the number of bear days is important. A chart has 2 variables, price and time. Many trends begin with time (a streak of trend days) before price. Traders now believe that there will be a successful breakout below the 3 month range.
Every trend will have many reversal attempts. But, my 80% inertia rule also applies to trends. Once a market is in a trend, 80% of reversal attempts will fail and become bear flags. While the daily chart is still in its 3 month range, it is also in an early bear trend. Therefore, day traders will look to sell 50 – 100 pip rallies this week. They expect each to lead to a new low.
Because the selloff on the 5 minute chart was not climactic, bull day traders are buying reversals for 10 – 20 pip scalps. The bears will sell rallies for scalps and swings.
Summary of today’s S&P Emini futures price action and what to expect tomorrow
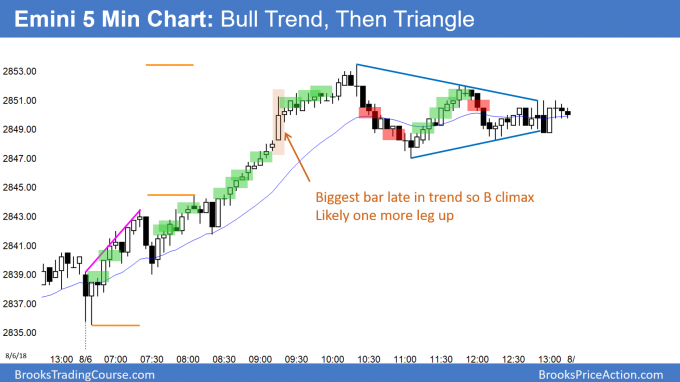
Here are several reasonable stop entry setups for today. I sometimes also show limit order entries and entries on the close of bars. My goal with these charts is to present an Always In perspective. If a trader was trying to be Always In or nearly Always In a position all day, and he was not in a position at the moment, these entries would be logical times for him to enter.
While the 3 day rally has been strong, it is also a buy vacuum test of the July high and the 2850 Big Round Number. Furthermore, the Emini had its 3rd consecutive day in a tight bull channel on the 5 minute chart. This is unusual and therefore climactic. The odds favor a pause for 1 – 1 1/2 days starting within 2 days.
If the bulls get a breakout above today’s triangle, the triangle would likely be a Final Bull Flag. The result would be a pullback into the triangle on the 5 minute chart. However, the bull trend is strong enough to make a bear swing unlikely without at least a micro double top on the daily chart.
See the weekly update for a discussion of the price action on the weekly candlestick chart and for what to expect going into next week.
Traders can see the end of the day bar-by-bar price action report by signing up for free at BrooksPriceAction.com. I talk about the detailed S&P Emini futures price action real-time throughout the day in the BrooksPriceAction.com trading room. We offer a 2 day free trial.
When I mention time, it is USA Pacific Standard Time (the Emini day session opens at 6:30 am PST, and closes at 1:15 pm PST). You can read background information on the intraday market reports on the Intraday Market Update page.


