Weak Emini High 1 bull flag after March FOMC announcement
I will update again at the end of the day.
Pre-Open market analysis
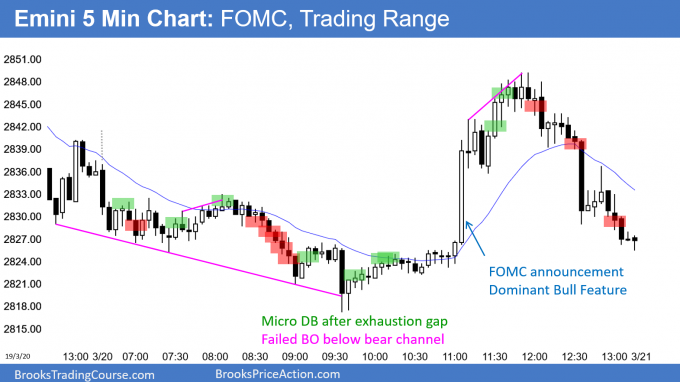
Yesterday reversed up on the FOMC announcement, but sold off into the close. By trading below Tuesday’s low, it became the 1st pullback after an 8 bar bull micro channel on the daily chart. The odds favored only a 1 – 3 day pullback before the bulls would buy again.
Yesterday is a High 1 bull flag and a buy signal bar for today. But, its bear body means that there will probably be more sellers than buyers above its high.
In addition, the daily and weekly charts are still in a buy climax at resistance. Consequently, the upside from here is probably only another week or so. A tight trading range for a few days is more likely than a resumption of the bull trend.
The odds favor at least a month of sideways to down trading that begins within a couple of weeks. It might have already started.
Overnight Emini Globex trading
The Emini is down 10 points in the Globex session. Today might therefore gap below yesterday’s low. If so, the gap will be small. A small gap typically closes in the 1st hour.
The 60 minute chart had a wedge top that turned down on Tuesday. This selloff will probably test the start of that wedge bull channel. That is the March 18 low of 2808.50.
The 8 day bull micro channel on the daily chart means the bulls have been strong. Even if it is a climactic top of the 3 month rally, the bears will probably need a micro double top. Therefore, this 1st leg down will probably get at least a 1 day bounce back up within the next few days.
There have been many big reversals over the past few days. This has allowed swing traders to make more profit than usual. Since markets tend to continue to do what they have been doing, today will probably have at least one swing up and one swing down as well.
Because the 1st selloff after an 8 day bull micro channel typically only lasts a few days, today will probably not be a big bear trend day. Also, after 2 bear days, there is now a Big Up, Big Down pattern on the 60 minute chart. That usually results in a trading range. Therefore, a big bull trend day is also unlikely. Day traders should look for at least one reversal after the 1st 1 – 3 hours.
Yesterday’s setups

Here are several reasonable stop entry setups from yesterday. I show each buy entry with a green rectangle and each sell entry with a red rectangle. I rarely also show limit order entries and entries on the close of bars. My goal with these charts is to present an Always In perspective. If a trader was trying to be Always In or nearly Always In a position all day, and he was not currently in the market, these entries would be logical times for him to enter.
EURUSD Forex market trading strategies

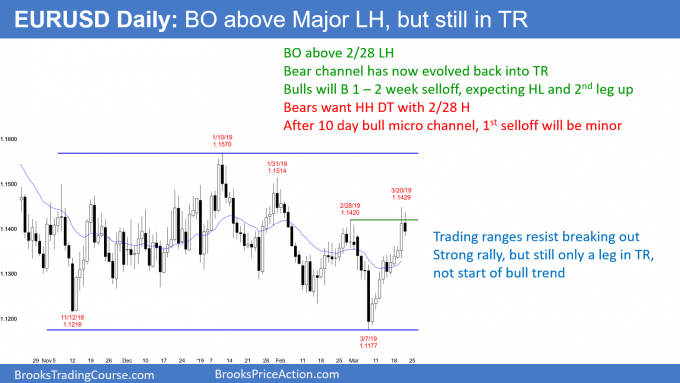
The EURUSD daily Forex chart had a big bull trend day yesterday. By breaking above the February 28 major lower high, it ended the bear trend that began on January 10. The chart is once again neutral.
Yesterday was a big day and it was late in a rally. It was therefore a buy climax. Bulls will start to take profits and bears will begin to short.
However, the rally has not had a pullback in 10 days. A 10 day bull micro channel is a sign of strong bulls. Typically, the 1st reversal down will be minor. The bears usually will need at least a micro double top before they can start a 2 – 3 week leg down.
The 1st targets of a selloff are yesterday’s buy climax low, the 20 day EMA, and a 50% pullback. All are usually close to one another.
Since the bears typically need a micro double top after a strong rally, the bulls will buy the 1st 1 – 3 day pullback. That will limit the downside for a few days.
Because yesterday was a buy climax in a 4 month trading range and every leg for 4 months has lasted 2 – 3 weeks, the upside is probably limited as well for a few days. The result will probably be a few sideways days.
Overnight EURUSD Forex trading
After breaking above the February 28 major lower high yesterday, the EURUSD 5 minute chart has sold off 50 pips. This was likely because the daily chart is still in a trading range, and a buy climax typically attracts profit takers. It usually transitions into a trading range. Consequently, the next few days will probably be sideways.
The range is currently big enough for day traders to scalp for 20 pips. However, that will probably shrink to 10 pips as the day goes on. The odds favor a 100 pip tall trading range for several days.
Can the rally continue up to the top of the range? Probably not without at least a 1 week pullback. They bulls will likely need a test of the March low. That would create a higher low major trend reversal.
Can a reversal from here continue down for 2 weeks? After 10 days without a pullback, the bulls will be eager to buy below the low of the prior day. The 1st reversal down will probably only last a few days.
Summary of today’s S&P Emini futures price action and what to expect tomorrow

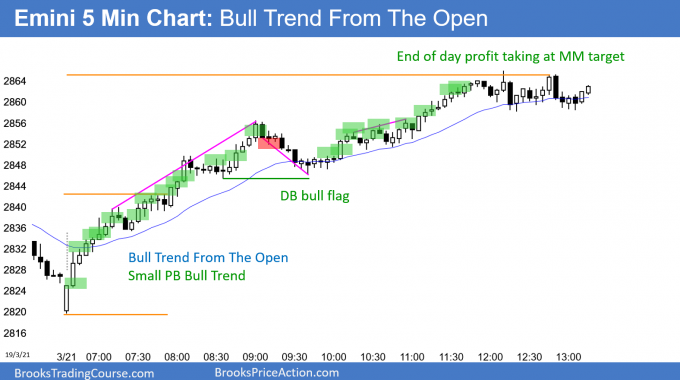
Here are several reasonable stop entry setups for today. I show each buy entry with a green rectangle and each sell entry with a red rectangle. I rarely also show limit order entries and entries on the close of bars. My goal with these charts is to present an Always In perspective. If a trader was trying to be Always In or nearly Always In a position all day, and he was not currently in the market, these entries would be logical times for him to enter.
End of day summary
Today was a huge Bull Trend From The Open day. Because today’s rally was so strong, it was climactic. Therefore, there is a 75% chance of at least a couple hours of sideways to down trading tomorrow that starts by the end of the 2nd hour.
Yesterday was a bear day and therefore a weak buy signal bar on the daily chart. Consequently, there might be more sellers than buyers above yesterday’s high. If so, tomorrow might form a micro double top with Tuesday’s high. Since the 3 month rally will probably end within the next 2 weeks, the bears are waiting for a micro double top before selling.
Less likely, the strong 3 month bull trend will continue up to the all-time high without 1st pulling back for a few weeks.
See the weekly update for a discussion of the price action on the weekly chart and for what to expect going into next week.
Trading Room
Traders can see the end of the day bar-by-bar price action report by signing up for free at BrooksPriceAction.com. I talk about the detailed S&P Emini futures price action real-time throughout the day in the BrooksPriceAction.com trading room. We offer a 2 day free trial.
Charts use Pacific Standard Time
When I mention time, it is USA Pacific Standard Time (the Emini day session opens at 6:30 am PST, and closes at 1:15 pm PST). You can read background information on the intraday market reports on the Intraday Market Update page.
Hi Al,
I was wondering how and when (in real time) you realized the market had entered a bull-trend-from-the-open day and that the pullbacks (until 9:00, at any rate) would be insignificant. I’m having the toughest time knowing when to get out if I’m trapped in the other direction.
Thanks in advance.
I assume that it is a Bull Trend From The Open on the close of the 1st bar, and maintain that assumption until there is evidence that it is wrong. Strong trends are rare so it is normal to assume that there will be a reversal. However, after the first 3 or 4 bars today, I said that the Emini was either going to continue as a bull trend or enter a trading range. The odds of a bear trend were small, and got smaller with every passing bar.
I sometimes say that it is good to be stupid. If the market is going up, don’t think too much. Just buy above a bull bar that closes near its high, use the appropriate stop (which is usually far below in a strong trend), and don’t get out any earlier than when a bar trades below the low of a bear bar. If I exit, but the market then forms a bull bar closing near its high, I want to buy above that bar, and repeat the process all day. All strong trends are always forming tops, but most fail. It is better to look for a resumption of the trend than for a reversal.
The market made several attempts at a parabolic wedge top. Most were not convincing. The one at 9:05 was, but with no pullback lasting more than 2 bars, a bigger pullback was likely to be simply that… a pullback and not a bear trend. When the 9 am bulls could not avoid a loss, I said that it was a good situation for the bulls. It was likely that the pullback would reverse back up to the highest close (9 am) close, even if it took a couple hours, and therefore buying the pullback was a high probability bet.
Hi Al, after I saw the 3rd bull bar I had a feeling it was going to be a strong day but the bar was right underneath the EMA and it spooked me out. I’m always leery when it is there. After the 4th and 5th bar I felt good about it. Was it ok to be leery of buying when the 3rd bar was close to the EMA?
I think the importance of EMA20 on a 5-minute chart is not as high as the context and the price action itself, which was “trend from the open” in this case. Remember that there is a “million” combinations of time frames and EMA settings that various traders use! For most other traders (not using a 5-minute chart) the price would be either above or below the EMA, not right at it, unless they used this particular setting of 20 bar EMA on a 5-minute chart.. Needless to say, a considerable percentage of traders may not be using EMA at all, but they are all looking at price action. Always keep that in mind.
On the other hand i completely understand your reluctance of buying at the EMA when the price was below it up until that point in time, things like that can be viewed as reasons not to enter a trade – there’s always something you can find to use as a reason not to enter. I guess what matters is which argument is stronger. I would be inclined to believe that in this case the argument of three consecutive bull bars on the open takes precedence over the appearance of moving average.
Gotcha. Totally makes sense. Thanks!