Emini January rally in sell zone despite buying pressure
I will update again at the end of the day.
Pre-Open market analysis
The Emini again reversed up at the February low yesterday. The bulls want the 3 week rally to continue to a new all-time high. Even if that were to happen, there will probably be a test of the December low first.
On the monthly chart, November was a bull doji bar. That is a weak sell signal bar. Consequently, there are strong bulls who bought its low and they scaled in lower.
When a trader takes a reasonable trade and manages it well, he typically can avoid a loss and usually can make a profit. Those bulls need this rally to get back to the November low. That would allow them to get out at breakeven on their 1st buy and with a profit on their lower buy. Therefore, 2,632.50 is a logical target for this rally.
While the rally has been strong, it will probably fail within a month or so. Because the Emini is now in the sell zone on the daily chart, it will probably pull back today or tomorrow.
Yesterday is a sell signal for a Low 2 bear flag. However, the momentum up is good and it was only a bear doji. That is a weak sell signal bar. Therefore, the bulls will probably buy any 1 – 3 day selloff.
Overnight Emini Globex trading
The Emini is up 12 points in the Globex market. Yesterday’s rally was in a bull channel on the 5 minute chart. Traders should think of a bull channel as a bear flag because there is a 75% chance of a bear breakout. This means a sideways to down move to below the bull trend line.
However, bull channels can last 2 – 3 days before there is a breakout. In addition, the momentum up on the daily chart is strong. Consequently, the rally might continue for another day or two before pulling back.
Since most of the trading over the past 6 days has had a lot of trading range price action, that is likely again today. But, every day has had at least one swing up or down.
Yesterday’s setups

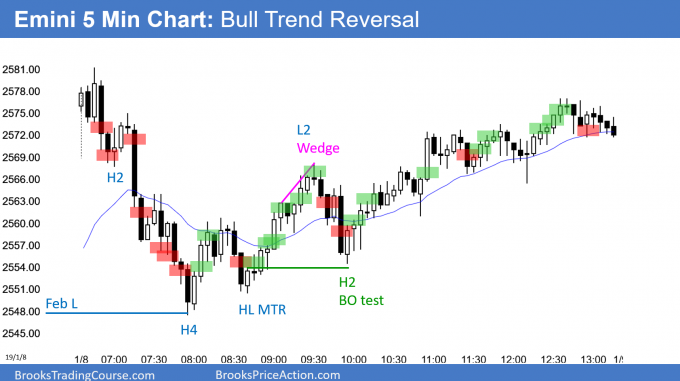
Here are several reasonable stop entry setups from yesterday. I show each buy entry with a green rectangle and each sell entry with a red rectangle. I rarely also show limit order entries and entries on the close of bars. My goal with these charts is to present an Always In perspective. If a trader was trying to be Always In or nearly Always In a position all day, and he was not currently in the market, these entries would be logical times for him to enter.
EURUSD Forex market has increased buying pressure in its trading range

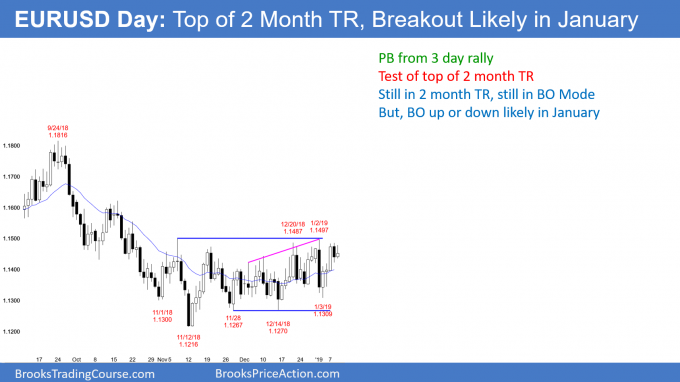
The EURUSD daily Forex chart reversed down yesterday from the top of its 2 month range. The bears want this to be the start of a move to below the range. However, the bulls see it as a pullback from a 3 day rally. They therefore want a break above yesterday’s high and then the top of the range.
When a market is in a trading range that lasts more than 20 bars, the odds of a bull breakout are the same as for a bear breakout. Each leg up and down is strong. Beginners keep thinking every leg will be the one that breaks out. But, experienced traders know that reversals are more likely than breakouts. They therefore buy low, sell high, and take profits a few days later.
It is important to note that there is something different this time. Every trading range over the past year broke out by around the end of the 2nd month. Also, big moves often begin in January. Consequently, the breakout is likely within a few weeks.
Also, since the November low, the bulls have had 2 streaks of 4 consecutive bull bars and 3 streaks of 3 consecutive bull bars. But, the longest the bears were in control was for 3 bars, and they did this only once. There is now relatively more buying pressure than selling pressure.
Charts have 2 variables, price and time. Sometimes time is more important in the early stages of a trend. This subtle relative increase in buying pressure makes a bull breakout more likely.
Overnight EURUSD Forex trading
The EURUSD 5 minute Forex chart traded in a 40 pip range overnight. Day traders are therefore scalping. But, since a breakout or a reversal is likely within a few days, they will quickly switch to swing trading on the 1st strong move up or down.
If there is a strong breakout above 1.15, they will expect at least a 200 pip measured move up over the next couple of weeks. The rally would probably continue up to the resistance of the September 24 major lower high at around 1.18.
Summary of today’s S&P Emini futures price action and what to expect tomorrow

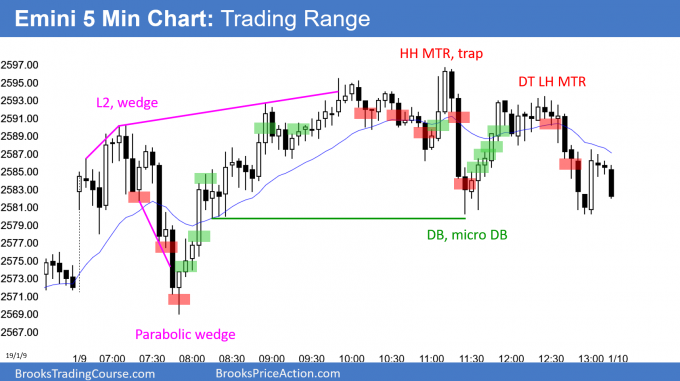
Here are several reasonable stop entry setups for today. I show each buy entry with a green rectangle and each sell entry with a red rectangle. I rarely also show limit order entries and entries on the close of bars. My goal with these charts is to present an Always In perspective. If a trader was trying to be Always In or nearly Always In a position all day, and he was not currently in the market, these entries would be logical times for him to enter.
The Emini sold off on the open, but rallied from a parabolic wedge sell climax. It reversed down from a measured move target from the low to the open. This is common trading range price action. It again closed near the open, forming another doji day. This increases the chance of a 1 – 3 day pullback beginning tomorrow or within a few days. After a 5 bar bull micro channel up to the sell zone, tomorrow will probably trade below today’s low.
See the weekly update for a discussion of the price action on the weekly candlestick chart and for what to expect going into next week.
Trading Room
Traders can see the end of the day bar-by-bar price action report by signing up for free at BrooksPriceAction.com. I talk about the detailed S&P Emini futures price action real-time throughout the day in the BrooksPriceAction.com trading room. We offer a 2 day free trial.
Charts use Pacific Standard Time
When I mention time, it is USA Pacific Standard Time (the Emini day session opens at 6:30 am PST, and closes at 1:15 pm PST). You can read background information on the intraday market reports on the Intraday Market Update page.
Al, why would you not take buy on bar 10? thx
Al,
You know how many people are out there that are dishonest instructors and how much confusion there is around this profession. You have dealt with them in your early stages too.
I speak for myself but I believe a lot of traders starting out are suspicious about this as well, and I’m sure a lot would greatly benefit from an actual proof or something concrete that shows it’s actually possible to make consistent profits as a retail day trader making decisions based on technical analysis.
That would take off their minds a huge doubt-burden and help them not getting disheartened when facing months in red, allowing them to really put their best effort into this. I know this request is a recurring one and tedious but please, empathize with those starting out and understand how much this would mean to them.
Thank you
This ain’t gonna happen.
However, may I suggest reading an old thread over at Brooks Price Action website.
Pay particular attention to funkybudha’s posts.
http://www.brookspriceaction.com/viewtopic.php?t=1461&postdays=0&postorder=asc&&start=25
Luca, you can do this yourself, open excell sheet and take statistics of one of the pattern.
Make rules, trade it on sample trades and see if you can make $. Please post it on the web side so we can have a share your of your hard work.
thx
Al,
I bought above bar 5 with a stop below bar 68 (yesterday). I did not exit and bought above bar 16 and exited break even on the first entry and a profit on the second entry. The trade worked out (This Time) but it was an unnerving ride. I see you didn’t mark bar 5 as a buy (why) and bar 9 as a sell. How could I have managed this trade in better (more conservative) way?
Thank you
Probability. There was no good buy signal bar in 1st 4 bars, and there weak follow-through on 6. I needed one more strong bull bar and did not get it with 6. This is not above average bullishness and therefore I do not want to pay an above average price (far above the EMA). Lots of trading range price action yesterday and again for 1st 4 bars today. Most days have trading range opens. This was likely once 6 was not a 2nd strong bull bar.
What about bar 5 kept it from being a buy signal bar? I don’t recall your mentioning much about it during the recap. Thanks for all your help.
Please see prior answer.