Emini and Forex Trading Update:
Wednesday March 4, 2020
I will update again at the end of the day.
Pre-Open market analysis
The Emini rallied strongly early on the Fed interest rate cut, but then sold off. It retraced about half of the 3 day rally. Yesterday was probably just a pullback from Monday’s rally. There will probably be a 2nd leg up.
However, the Emini will probably go sideways for another week or two as long as there is no big increase in the number of coronavirus cases. If there is, the odds of a 30 – 50% correction will go up from the current 30% chance.
I have said before that I do not have confidence in Fed Chair Powell. The reversal down on a big rate cut might in part be due to a lack of confidence in Powell. It is a sign that traders fear that there might be a bigger problem out there than what the Fed is telling us. In addition, they do not trust him to handle it.
The Emini will probably not get back to the all-time high for at least a few months. Traders repriced the market after the coronavirus outbreak.
The pandemic is unlikely to be contained, and there will not be a vaccine for at least a year. Consequently, the Emini will probably not recover its previous price for a long time.
If there is an acceleration of the number of cases, the Emini will fall 30 – 50%. There is currently only a 30% chance of a 30% selloff.
Overnight Emini Globex trading
Despite yesterday’s big selloff, it was probably a bull flag after an even stronger 2 day rally. The Emini is up 58 points in the Globex session and it is testing the start of yesterday’s bear channel. That is always a magnet after a Spike and Channel Bear Trend. The rally usually leads to a trading range.
Also, the Emini has been in a trading range for 3 days. Since the legs up and down have been huge, day traders have been able to swing trade.
It is important to remember that the daily range is about 10 times normal. Day traders should multiply stops and targets by 10 and divide their position size by 10. Trading Micro Eminis is a good way to reduce position size. Scalps are now 5 – 10 points instead of 1 – 2 points.
The daily ranges will begin to shrink over the next week. But it will probably be a month or more before they are back to the usual 15 – 20 points.
Yesterday’s setups

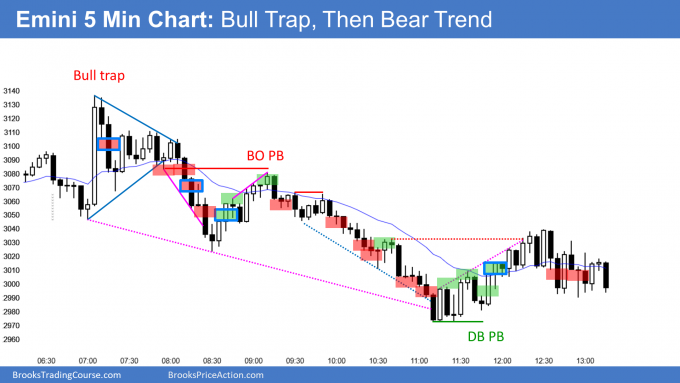
Here are several reasonable stop entry setups from yesterday. I show each buy entry with a green rectangle and each sell entry with a red rectangle. I rarely also show limit order entries and entries on the close of bars. Buyers of the Brooks Trading Course and Encyclopedia of Chart Patterns have access to a much more detailed explanation of the swing trades for each day.
My goal with these charts is to present an Always In perspective. If a trader was trying to be Always In or nearly Always In a position all day, and he was not currently in the market, these entries would be logical times for him to enter.
If the risk is too big for your account, you should wait for trades with less risk or trade an alternative market like the Micro Emini.
EURUSD Forex market trading strategies

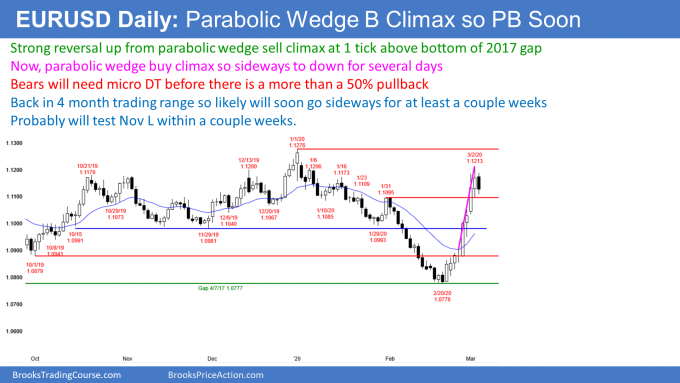
The daily chart of the EURUSD Forex market is near the top of a 6 month trading range. The 2 week rally has been strong but there have been 3 pushes up in a 10 day bull micro channel.
Yesterday’s high was also just above the top of the 18 month bear bear trend line (not shown). There is now a parabolic wedge buy climax at resistance. Traders should expect about a week of sideways to down trading. The pullback might retrace half of the rally and test the November low at the bottom of last year’s 4 month trading range.
Overnight EURUSD Forex trading
The 5 minute chart of the EURUSD Forex market rallied to test Monday’s high, but then sold off. It has been sideways for 3 days. Day traders are looking for reversals and 20 pip scalps. That will probably continue today.
Today so far is an inside day. If the bulls can get the close to be near the high, today would be a High 1 bull flag buy signal bar for tomorrow. Given the bull climax at resistance on the daily chart, there is probably not much left to this rally.
It is more likely that today will close below the open. If the bears can get the close to be near the low of today, today will be a sell signal bar on the daily chart.
But after 10 days without a pullback, there will probably be buyers tomorrow not far below today’s low. However, the buy climax will probably result in the EURUSD trading sideways to down for about a week. Yesterday’s high is a credible start of the pullback.
Summary of today’s S&P Emini futures price action and what to expect tomorrow

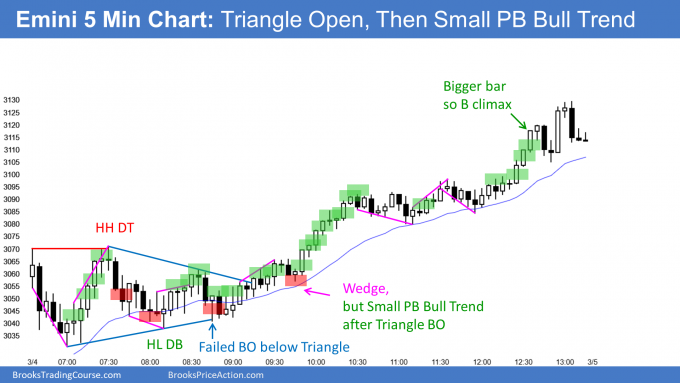
Here are several reasonable stop entry setups for today. I show each buy entry with a green rectangle and each sell entry with a red rectangle. I rarely also show limit order entries and entries on the close of bars. Buyers of the Brooks Trading Course and Encyclopedia of Chart Patterns have access to a much more detailed explanation of the swing trades for each day.
My goal with these charts is to present an Always In perspective. If a trader was trying to be Always In or nearly Always In a position all day, and he was not currently in the market, these entries would be logical times for him to enter.
If the risk is too big for your account, you should wait for trades with less risk or trade an alternative market like the Micro Emini.
End of day summary
The Emini was in a triangle above the EMA for the 1st couple of hours. It then broke to the upside and rallied in a Small Pullback Bull Trend.
Today was a bull inside day on the daily chart. The bulls see it as a High 1 buy signal bar in what they hope is a bull trend. However, the rally is more likely a bull leg in what will become a trading range. Traders expect the rally to go at least a little higher tomorrow.
The Emini will probably be sideways for at least several weeks, as long as there is no significant increase in the number of coronavirus cases.
See the weekly update for a discussion of the price action on the weekly chart and for what to expect going into next week.
Trading Room
Traders can see the end of the day bar-by-bar price action report by signing up for free at BrooksPriceAction.com. I talk about the detailed S&P Emini futures price action real-time throughout the day in the BrooksPriceAction.com trading room. We offer a 2 day free trial.
Charts use Pacific Standard Time
When I mention time, it is USA Pacific Standard Time (the Emini day session opens at 6:30 am PST, and closes at 1:15 pm PST). You can read background information on the intraday market reports on the Market Update page.
Hi Al,
Thank you for your analysis.
Would like to ask how we could predict the duration of market going sideways using price action? We all know with the great drop like last week, the market will have another bear leg. Since the great drop was happened in the last week of February, there is chance that the market goes sideways for few bars in terms of weekly chart, which means around a month before 2nd bear leg. But I guess we may also say there will be few bar sideways in monthly chart, which will mean we need to wait for several months. That’s why would like to know how we could predict it.
The more climactic a move is, the more traders wonder if the selloff fully repriced the market. It needs to be repriced because of the coronavirus. But more importantly, because of the monthly chart. I have been saying for a couple years that it would fall at least 30% and probably close to 50% within 5 years. This might be the start. That has to do with charts and not coronavirus.
Without surprisingly bad news (which I believe is inevitable) the Emini typically will spend more time sideways as traders decide if it went low enough. I therefore suspect that it might be in a trading range for a few weeks. But I still think there is only a 30% chance that this rally will be like the January 2019 rally and go straight up. I also still believe that there is a 50% chance of at least a 20% correction and a 30% chance of a 30 – 50% correction.
Hi Mr. Brooks,
Thank you very much for your analysis.
My question is regarding Gaps on the Globex market.
Have you done any investigation relating to the probability of gaps filling or being left open?
In my experience (which isn’t near your 30 years), the market always goes back and fills them.
Thanks for all you do.
Gaps on the Globex chart are much less common than on the day session chart. However, my opinion is that 70% of gaps fill, but some take years before they are filled. Others get tested, but stay open.
Look at the rally in the EURUSD over the past 3 weeks. The EURUSD collapsed in January, but reversed up violently from only 1 pip above the bottom of a gap from 2 years ago. That is an example of how traders pay attention to gaps long after they form.
One gap on the Globex chart that I am watching is the one above the February 12, 2016 high. Even though that high is currently 1858.25 and 45% below the all-time high, I suspect it will get filled as long as the Emini does not go far above its current all-time high.
The bottom of that 2 year trading range is a magnet. Since I believe there will be a 40 – 50% correction within a few years, as long as it comes from around current levels, that gap would be a magnet.