Trading Update: Friday January 28, 2022
Emini pre-open market analysis
Emini daily chart
- Yesterday was the 4th day in a tight trading range after a breakout below the October low, which is the bottom of a 6-month trading range. An Emini low 1 sell signal.
- Since yesterday was an inside day, it is both a buy and sell signal bar. However, it was a big bear bar closing near its low in a bear trend. It is a low probability buy signal.
- It is also a sell signal bar. But it is coming after Monday’s big reversal up from below the 6-month range and it is in a tight trading range. That reduces the probability of a big move down. There might be more buyers than sellers below its low and below Monday’s low.
- With the huge swings up and down, traders should be prepared for anything.
- While there could be a big breakout up or down today, after 4 sideways days.
- However, all 4 days have oscillated around the open of the week. Traders therefore see that as an important magnet. That increases the chance that today will try to close around the open of the week. That and 4 sideways days increase the chance of a 5th consecutive sideways day.
- After the strong reversal down from the wedge top on the daily chart, traders will sell the 1st 1 – 3 week rally.
- That lower high will create a head and shoulders top. All tops have about a 40% chance of some kind of measured move down. There is a 60% chance that the market will be mostly sideways and eventually will resume the 2-year bull trend.
- Monday is the final trading day in January. January is going to have a bear body on the monthly chart.
- December is an outside down month. The bulls have been strong for 2 years. They will try to get the month to close above the December low. Since that is 200 points above, it is probably too far to reach in 2 trading days.
- The more January closes on its low, the more likely February will trade lower.
- The more January closes in its middle, the more likely February will be more sideways.
Emini 5-minute chart and what to expect today
- Emini is down 1 point in the overnight Globex session, and very close to the open of the week.
- It will open in the middle of 4 sideways days and at the open of the week. That increases the chance that today will be another sideways day.
- But even if it is, the daily ranges have been huge. Therefore, there should be at least one swing trade in each direction.
- If there is a series of strong trend bars up or down, there would be an increased chance of a trend day. Currently, a trading range day is more likely.
Yesterday’s Emini setups


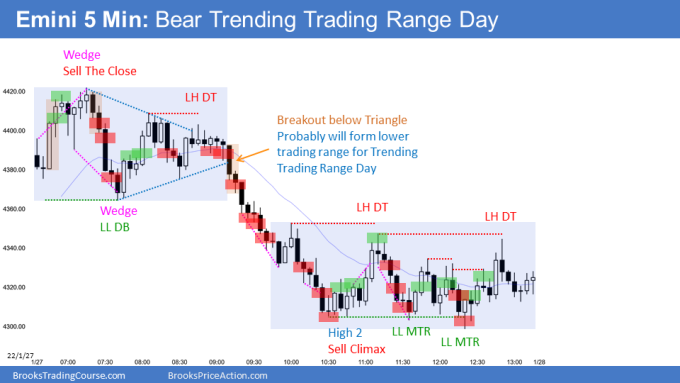
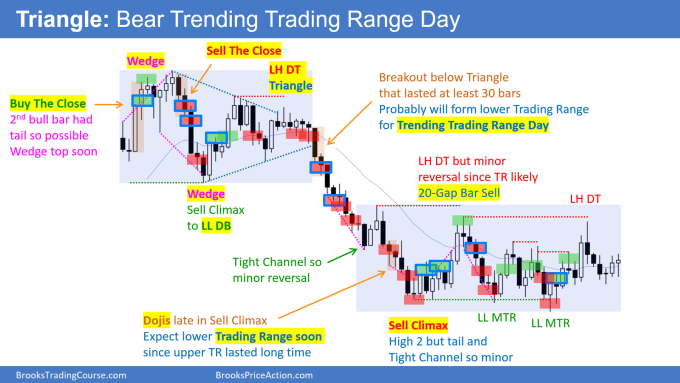
Here are several reasonable stop entry setups from yesterday. I show each buy entry with a green rectangle and each sell entry with a red rectangle. Buyers of both the Brooks Trading Course and Encyclopedia of Chart Patterns have access to a much more detailed explanation of the swing trades for each day (see Online Course/BTC Daily Setups).
My goal with these charts is to present an Always In perspective. If a trader was trying to be Always In or nearly Always In a position all day, and he was not currently in the market, these entries would be logical times for him to enter. These therefore are swing entries.
It is important to understand that most swing setups do not lead to swing trades. As soon as traders are disappointed, many exit. Those who exit prefer to get out with a small profit (scalp), but often have to exit with a small loss.
If the risk is too big for your account, you should wait for trades with less risk or trade an alternative market like the Micro Emini.
EURUSD Forex market trading strategies
EURUSD Forex daily chart

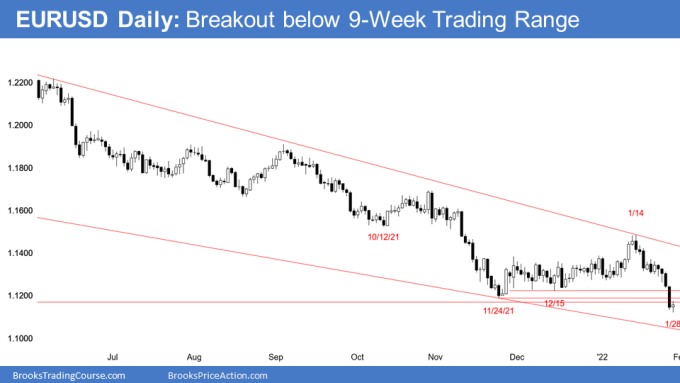
- The EURUSD Forex market broke strongly below the 9-week trading range yesterday.
It also broke below the June 19, 2020 higher low, which was the start of the 2020 bull channel. - The bears want a 200-pip measured move down.
- They hope the yearlong bear trend will continue down to the 2020 low and then below the bottom of the 7-year trading range.
- Yesterday was a Bear Surprise Bar. Traders should expect at least a small 2nd leg down after the 1st bounce.
- Today is the follow-through bar. So far, it is a bull doji, which is weak follow-through.
- The more it is a big bear bar closing near its low, the more likely the EURUSD will continue lower.
- The bulls want a bull day today or Monday, and especially a big bull bar closing near its high. That would be a sign of a possible failed breakout.
- I have been saying that the bear trend was unlikely to go straight down to 2020 low without at least a couple months of sideways to up trading 1st. While it was likely that the pause would have gone higher, it still met my minimum goal of 2 months of sideways to up trading.
- That relieved some of the oversold condition, and bears are now more confident about selling again.
- The monthly chart has been sideways for 7 years. Since trading ranges resist breaking out, it is still more likely that this selloff will reverse up for many months before breaking below the 7-year range.
- However, the more consecutive bear bars, the higher the odds will be of a successful breakout.
- The next target for the bears is the bottom of the yearlong bear channel, which is another 100 pips below.
Summary of today’s S&P Emini futures price action and what to expect tomorrow

End of day summary
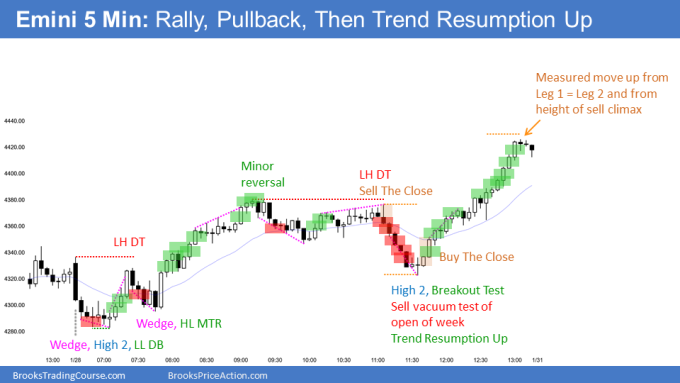
- Today sold off on the open to below yesterday’s low. As was likely, there were more buyers below, despite the Low 1 sell signal on the daily chart.
- After rallying for a couple hours, the Emini reversed back down to the open of the week, which has been an important magnet every day this week.
- It then rallied to close near the high. Today is a good High 2 buy signal bar on the daily chart.
- Today was the 5th day in a tight trading range at the bottom of a 6-month trading range. If the Emini can’t go down, it will probably try the other direction.
- The extreme sell climax reversed up strongly on Monday from the October low at the bottom of the 6-month trading range.
- The bears were unable to continue down all week
- The Emini should rally for at least a week or two. The minimum target is the December low. Other targets are a 50% pullback. Less likely, it will continue up in a Small Pullback Bull Trend to a new high without more than a 3-day pullback (V-bottom).
- The bulls would like to reach the December low before Monday’s close. January probably will close around that level, which means Monday should rally.
- January is the 2nd bar of consecutive outside bars on the monthly chart. It is therefore both a buy and sell signal bar.
- With the micro wedge and the 2nd attempt to reverse down, it is more likely that February will trade below the January low. That would trigger the sell signal and lead to another month or two down, maybe to around 4,000.
- However, January will probably have a big tail on the bottom, and that lowers the chance of a big selloff in February.
- If January closes in the middle of its range, which is likely, it will increase the chance that February will be mostly sideways, even though the Emini should rally next week.
- If Russia invades the Ukraine and if Europe messes it up, the stock market could fall to the pre-pandemic high before going up.
- But Putin will not consider an invasion until mid-February since he will lose China’s support if he invades during the China Olympics. That absence of danger for a couple weeks should lead to a rally.
- But even if February triggers the monthly OO sell signal, the Emini should bounce for at least a couple weeks in early February. Traders should then expect a 2nd leg sideways to down later in the month, assuming the rally does not go straight up to a new high.
- With the cluster of magnets around 4,000, that is a reasonable target area for the bottom of the correction if the Emini reverses down from a lower high.
- The odds favor a resumption up at the end of the year. However, trading ranges can last a long time. Therefore, the current 6-month range could last all year, and the bull breakout might not come until next year.
- The week closed near its high. It is a buy signal bar for a lower low double bottom with the October low. The Emini should trigger the weekly buy signal, in addition to the daily buy signal, next week.
See the weekly update for a discussion of the price action on the weekly chart and for what to expect going into next week.
Trading Room
Traders can see the end of the day bar-by-bar price action report by signing up for free at BrooksPriceAction.com. I talk about the detailed S&P Emini futures price action real-time throughout the day in the BrooksPriceAction.com on trading room days. We offer a 2 day free trial.
Charts use Pacific Time
When I mention time, it is USA Pacific Time. The Emini day session charts begin at 6:30 am PT and end at 1:15 pm PT which is 15 minutes after the NYSE closes. You can read background information on the market reports on the Market Update page.
At the 11:30 reversal, would it not have been reasonable to expect it to be minor given the strength of the bear move? Why take the very first buy signal when we routinely ignore good looking first reversal signal bars in strong moves?
I am happy to share some comments regarding this. You are correct in your thinking. There should be a second leg down after the 6 bar selloff around 11:30. However, look to the left, and you will notice the price is forming a possible higher low, and this selloff may be a 2nd leg trap. If you look at a smaller time frame, you will notice at 11:30, the price did get the 2nd leg down, which was the minimum the bear expected.
One thing to point out is that the odds did not favor a strong rally into the close like what happened on this day. The rally trapped bears in and bulls out around 11:30, which happens on 2nd leg traps. Here, the bears got trapped in a bad trade, and the bulls got trapped out of a good trade.
Overall, as strong as the selloff was, it was still a higher low and a large 2nd entry buys (H2). It was also a vacuum test of the open of the day and the open of the week.
Appreciate the reply!
I had around 4326 – 4336 as a major support area (breakout points from bar 1 and 11, and also retest area of bar 16 breakout) and I would’ve been open to reversing but not as quickly as bar 63. I was pretty shocked at how quickly bar 62 reversed because it was another doji bar until the last second or two. But we all know how quickly bars can change at the end 🙂 I really thought there would be one smaller leg down but this is a great lesson.
There was also a failed micro double bottom breakout (bars 59/60/61) which resembled bars 68/69/70/71 from the FOMC sell climax bottom on Wednesday. Both led to quick and large reversals. I had this in mind but it was much easier to see the legs on Wednesday and my mind was completely married to the expectation of another pronounced leg down. I’ll definitely be more wary of these micro ledges at support/resistance followed by strong reversal setups.
I totally agree with the 11:30 selloff being a 2nd leg from the 12:00 – 1:00 selloff and vacuum test of the opens. Do you say that the odds were unlikely for a strong rally into the close because a) the weekly open price got so much attention thus making it likely to close around there, or b) because traders were trapped out so no fuel to the fire, or c) you expected a rally into the close but not a strong one? I know that the price action favors sideways to up over the next couple weeks so a close near the week’s open made sense but if there’s a late vacuum test of that price and strong bounce, I can also see how there would be a strong buy the close type rally into the end of the week. I feel like strong moves to end the week can happen sometimes. I just thought there would be one more small leg down first 😀
I mean that the rally from 11:30 to the close was a low probability move. This is because you have to have trapped traders for the move to go that far up. There were bulls at 11:45 who were not long, and they will use any pullback to enter (trapped out of the market). There are bears at 11:45 who are trapped into a losing trade and will use any pullback to buy back shorts with a smaller loss.
Both the bulls desperately buy to enter a rallying market, and the bears buying back shorts causes the market to keep going up.