Emini and Forex Trading Update:
Wednesday March 18, 2020
I will update again at the end of the day.
Pre-Open market analysis
Today is a very dangerous day.
But, the bulls have a chance. Yesterday again tested the December 2018 low, and it again held above. In fact, yesterday’s low was above Monday’s low and its high was below Monday’s high. Therefore, yesterday was an inside day. Traders see it as a Breakout Mode day. It is both a buy and sell signal bar on the daily chart.
While unlikely at the moment, today could be a 2nd consecutive inside day. If it is, it would increase the chance of a short covering rally beginning tomorrow.
However, the Emini has been locked down at the -5% limit in the Globex market. Today still might be an inside day, but the bulls have been unable to create a credible bottom on any time frame. The odds of another leg down on the daily chart have been increasing over the past few days.
What about the parabolic wedge sell climax on the daily chart? It will lead to a strong short covering rally. However, the sell climax can grow and grow before that rally begins. Until it begins, the sell climax is still growing.
The hesitation at just above the December 2017 low has made traders wonder if the rally will begin just above that low. It has not yet so there is nothing to buy unless a trader can trade small, use a very wide stop, and scale in lower.
50% chance of one more big leg down
The next target below the December 2017 low is a symbolic one. President Trump took office on January 20, 2017. The S&P cash index opened at 2269.96 on that day. If the market falls below that level, it will be below it was when he took office. It will have given back all of the gains of more than 3 years.
There is a 50% chance of a break below the December 2018 low and a test of 2269.96 before there is a bear rally. In addition, there is currently a 30% chance that the Emini will break below 2000 before there is a 2 – 3 week bear rally.
Bear markets tend to fall until there is no left who is desperate to sell. It is impossible to know in advance if there are still a lot desperate longs who have not yet exited but unwilling to take much more pain.
If there are, the smart bulls and bears will know it and they will flush them out. Why should a smart bull buy now if he thinks he can soon buy lower? Also, why would a smart bear stop selling if he believes that there are a lot of weak bulls who will exit in a panic if the market falls just a little lower?
This might turn into a Crash
The Emini is locked limit down in the Globex session. If the day session falls 2% more, it will be locked limit down at -7%.
It almost hit the next circuit breaker on Tuesday at -13%. It it does today, traders will begin to refer to this bear market as a crash.
I have been trading since before the 1987 Crash. That was just one day. This developing Crash has already fallen more, and it has done more damage.
Starting in late 2017, I have been saying that the stock market would have at least a couple 40 – 50% selloffs staring before 2022. This selloff will probably be the 1st one. This is true even if the Emini reverses up strongly today. Traders should expect the emini to be lower 6 – 12 months from now.
When there is as much damage as there has been, the market will need years to heal. There will be strong rallies that last many months and possible a year or more. But, this is probably the start of a trading range that will last for a decade.
Overnight Emini Globex trading
The Emini will probably open below the Globex limit down level. It might even open 2% lower at -7%. That would trigger the 1st day session trading halt.
The danger of a crash today is real. If the Emini falls to -7%, it will probably break below the December low.
The January 20, 2017 open is only 3% below that. And the -13% limit level is only another 3% lower at around 2162 in the Emini. These levels are approximate because the CME calculates a theoretical closing price from yesterday. It is not exactly what you see on the chart.
The final trading halt comes at -20% at around 1988. That is below the 2000 Big Round Number, and about 41% down from the all-time high. If it is hit, trading stops for the rest of the day.
Be very careful today
The market has been making huge moves up and down. That will continue indefinitely. Today has the potential to have huge moves in either direction and in both directions. For example, a huge selloff could be the final flush and it could lead to a strong rally for the next several months.
Traders with small accounts should be very careful. They should go into the day expecting not to trade today. If they are thinking about buying, they must trade an extremely small position and only if the Emini is clearly strongly reversing up. Buying calls is a safer choice.
For the bears, it is always difficult to sell as a market is crashing. If a trader sells, he must trade very small. Also, he must get out if there is a strong reversal up. This is because there could be a violent bull trend reversal. If so, there may not be a pullback to where many bears would have shorted.
Yesterday’s setups

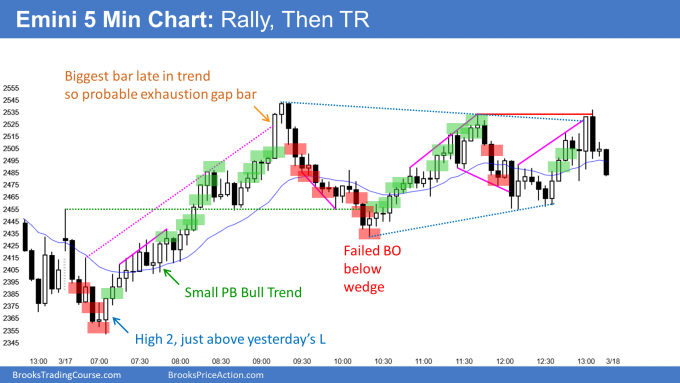
Here are several reasonable stop entry setups from yesterday. I show each buy entry with a green rectangle and each sell entry with a red rectangle. I rarely also show limit order entries and entries on the close of bars. Buyers of the Brooks Trading Course and Encyclopedia of Chart Patterns have access to a much more detailed explanation of the swing trades for each day.
My goal with these charts is to present an Always In perspective. If a trader was trying to be Always In or nearly Always In a position all day, and he was not currently in the market, these entries would be logical times for him to enter.
If the risk is too big for your account, you should wait for trades with less risk or trade an alternative market like the Micro Emini.
EURUSD Forex market trading strategies

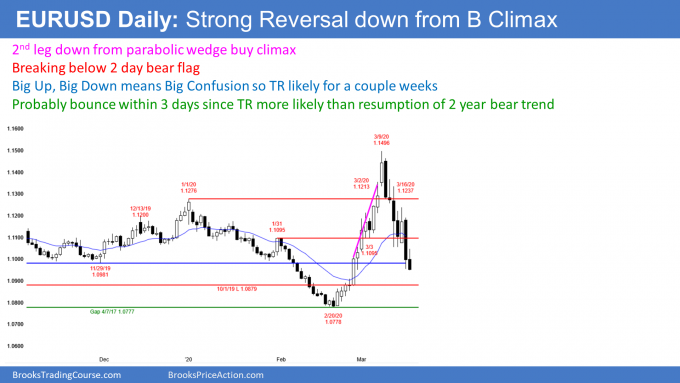
The daily chart of the EURUSD Forex market has been selling off strongly for 2 weeks. However, it is still above the bottom of the 3 week bull trend reversal. Consequently, this selloff is more likely a bear leg in a trading range than a resumption of the 2 year bear trend.
With the crashing of the world financial markets over the past few weeks, there has been a flight to safety. The US is typically the least bad country during a crisis and investors tend to shift assets into dollars.
Overnight EURUSD Forex trading
The 5 minute chart of the EURUSD Forex market has been selling off again overnight. But it was been sideways for the past 4 hours. The EURUSD broke below that range 15 minutes ago. However, a trading range is an area of agreement and a magnet. Therefore, there is at least a 50% chance of a reversal back up into that range this morning.
Can the EURUSD sell off strongly from here today? With two 60 pip rallies overnight, the EURUSD will probably not fall much further today. In fact, a 3rd rally to back above 1.10 is more likely.
Will today be a big bull trend day? After falling 130 pips from the overnight high, the best the bulls can probably get today is a reversal back up to the middle of the day’s range.
Summary of today’s S&P Emini futures price action and what to expect tomorrow

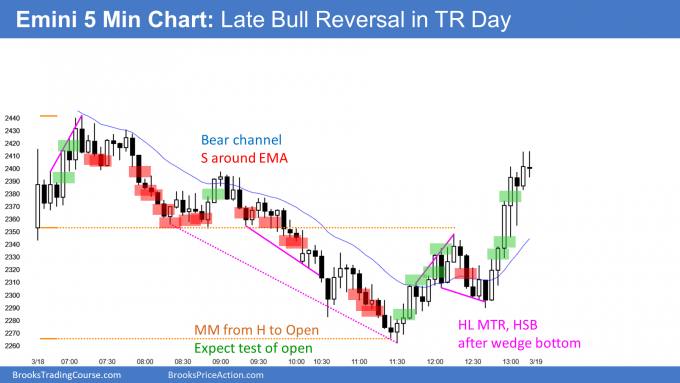
Here are several reasonable stop entry setups for today. I show each buy entry with a green rectangle and each sell entry with a red rectangle. I rarely also show limit order entries and entries on the close of bars. Buyers of the Brooks Trading Course and Encyclopedia of Chart Patterns have access to a much more detailed explanation of the swing trades for each day.
My goal with these charts is to present an Always In perspective. If a trader was trying to be Always In or nearly Always In a position all day, and he was not currently in the market, these entries would be logical times for him to enter.
If the risk is too big for your account, you should wait for trades with less risk or trade an alternative market like the Micro Emini.
End of day summary
The Emini is continuing to crash down on the daily chart. Today dipped down below the January 20, 2017 open. That is when Trump became president. The crash has erased all of the gains since he took office.
The bears took profits late in the day and today closed in the upper third. It is a weak buy signal for tomorrow. There is a 5 day wedge within a parabolic wedge on the daily chart. Traders expect a strong short covering rally to begin soon.
I was trading during the 1987 Crash. This one is worse. It is the most serious selloff since 1929. There is now tremendous damage to the market and most companies. They will need years to recover. Traders should expect a trading range for the next decade.
Sell climaxes can fall a long way before there is a strong short covering rally. Traders expect the selling to stop within a week or so. Then, there will either be a bear rally or a trading range for several weeks.
See the weekly update for a discussion of the price action on the weekly chart and for what to expect going into next week.
Trading Room
Traders can see the end of the day bar-by-bar price action report by signing up for free at BrooksPriceAction.com. I talk about the detailed S&P Emini futures price action real-time throughout the day in the BrooksPriceAction.com trading room. We offer a 2 day free trial.
Charts use Pacific Standard Time
When I mention time, it is USA Pacific Standard Time (the Emini day session opens at 6:30 am PST, and closes at 1:15 pm PST). You can read background information on the intraday market reports on the Market Update page.
Hi Al,
I also saw that it seems a wedge bottom in the middle of the day. But as what you have said in the course, the spacing between 1st leg and 2nd leg is much more than 2nd leg to 3rd leg which means it probably a bad wedge. Also it broke to a new low where I am not confident to do buy even if it reverse back.
May I know is there any sign that shows a chance of reversal earlier than higher low MTR? So I could identify it earlier in the future.
Al often says to look at strength of bars, bars closing at or near their highs, gap bars, little or no bull bars in a bear trend and vice versa and so on.
Usually to have a reversal you need to see the bears getting weaker and weaker while at the same time bull pullbacks getting bigger and reaching higher.
Yesterday I could just feel how the market wanted to go down and although there were signals for buying they didn’t go far.
In such an environment I would wait for a really strong bull breakout and confirmation before buying anything.
at or near their lows*
Hi Al
Do you plan on holding the SPY calls through the weekend?
Given what your wrote, would you recommend people still keep buying SPY in their 401K every pay period or wait until there is a bottom.
I wrote about that over the weekend and said that it is better to not be buying in a retirement account yet because the market will probably not see the final low for many months. I am not a financial adviser, but I can tell you that it is too early for me. However, If a person is young and he dollar cost averages, the math is still good 5, 10, and 20 years from now.
you mean dec 2016 low and trump took office in jan 2017?
The December 2018 low was a major low and it is important. The market is also going to pay attention to the open of January 20, 2017, when the president was sworn in.
Can you please upload a little bit earlier? Thanks.
Hi Spring,
It is not really practical, or possible, for Al to upload any earlier as given his time zone the market opens at 06:30am. Al needs to get up soon after 05:00am as it is!