Emini and Forex Trading Update:
Monday May 18, 2020
I will update again at the end of the day.
Pre-Open market analysis
The Emini reversed down from a double top last week. Traders are wondering if the selloff is the start of a move down to 2600.
However, the bulls see Thursday as the buy signal bar for a High 2 bull flag. There is a lower low double bottom with the May 4 low.
When a market is in a bull trend, it resists reversing. This is especially true when the high is near major resistance. It usually has to touch that resistance before there is a reversal down.
The top of the 2 month rally is near the 100, 150 and 200 day moving averages. All are important resistance. Traders are still wondering if the bull trend has to reach those magnets before the bulls will take profits and the bears will short.
Since the Emini has been sideways for 3 weeks, the odds have been 50-50. Traders need more information. If today or tomorrow are strong bull days, the rally will probably continue up to the moving averages and the 3,000 Big Round Number before reversing. Otherwise, it should form a small lower high and reverse down to 2600 in May or June.
Breakout Mode
The bears want this week to stay below last week’s high. If it does, this week will be an inside bar on the weekly chart. Since last week was an outside bar, there would be an ioi (inside-outside-inside) Breakout Mode pattern on the weekly chart. That would not change things because traders already see it a being in Breakout Mode.
Overnight Emini Globex trading
The Emini is up 80 points in the Globex session. It will therefore gap far above Friday’s high. It might even gap above last week’s high.
When there is a big gap up, there is an increased chance of a trend day. Up is slightly more likely than down.
However, the Emini will open far above the average price (the 20 day EMA). Traders will not pay a price that is far above average unless they are buying bars that are far above average. The bulls want to see a couple big bull bars closing near their highs within the first 5 bars. If they get that, day traders will begin to buy, even though they would be paying far above the average price.
The bears see a price far above average as a good price to sell. But want some evidence that the price is being rejected as too high. Day traders will sell if there are one or two big bear bars closing near their lows on the open or within the 1st few bars.
Most often, whether there are strong bull or bear bars on the open, a big gap up leads to a trading range open. That means 2 or more reversals in the 1st hour or two. If that happens, the bulls will look to buy a double bottom or wedge bottom near the 20 bar EMA. Also, the bears will look for a double top or a wedge rally to sell for a swing down.
Friday’s setups

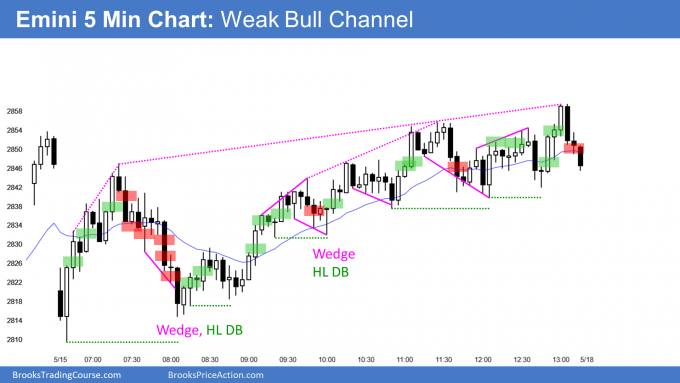
Here are several reasonable stop entry setups from Friday. I show each buy entry with a green rectangle and each sell entry with a red rectangle. I rarely also show limit order entries and entries on the close of bars. I do not want the lines to be distracting. If they are longer, I make them dotted. But, they have to be visible, so I make the shorter ones solid. Buyers of the Brooks Trading Course and Encyclopedia of Chart Patterns have access to a much more detailed explanation of the swing trades for each day (see Online Course/BTC Daily Setups).
My goal with these charts is to present an Always In perspective. If a trader was trying to be Always In or nearly Always In a position all day, and he was not currently in the market, these entries would be logical times for him to enter.
If the risk is too big for your account, you should wait for trades with less risk or trade an alternative market like the Micro Emini.
EURUSD Forex market trading strategies

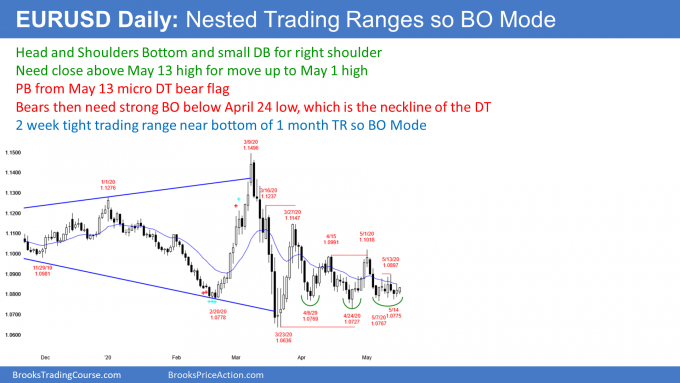
Traders are deciding if the EURUSD Forex market on the daily chart will rally from a head and shoulders bottom or sell off from a double top bear flag. If the bulls can get a close above the May 13 high, traders will expect a move up to the May high. After that, they will try to continue the rally up to the March high.
But if the bears get a close below the May 7 low, traders will conclude that the bottom has failed. They will then look for a break below the March low and possibly a move down to par (1.0).
A small bear bar today or tomorrow would convert the 2 week trading range into a triangle. But that would not change anything because the chart already is in Breakout Mode. A bull day today or tomorrow would make an upside breakout slightly more likely.
With the bull bars near the bottom of a 2 month trading range, the daily chart looks slightly more likely to go up. However, the monthly chart is in a 2 year bear channel (I showed it over the weekend). It therefore is slightly more likely to have a bear breakout.
This is a neutral market. Traders are taking quick profits, but expect a 200+ pip move up or down to begin within the next few weeks.
Overnight EURUSD Forex trading
The 5 minute chart of the EURUSD Forex market rallied 40 pips from Friday’s close. Friday was a bull day. The bulls would like the overnight rally to grow into a big bull trend day.
However, so far, the bars are small. Furthermore, most days over the past 2 weeks have been small. At a minimum, the bulls want today to close near its high. That would be a 2nd consecutive bull bar on the daily chart. It would slightly increase the chance of a breakout above last week’s high later this week.
The bears always want the opposite. They would like today to close near its low. It would then be another sell signal bar on the daily chart.
However, the overnight rally has been in a Small Pullback Bull Trend. That reduces the chance of a reversal down today. Furthermore, day traders are not going to sell until the see one or more 20 – 30 pip pullbacks today. Without that, it will be very difficult from them to make money shorting.
Because the rally has small bull bars and most days over the past 2 weeks have been small, day traders do not expect today’s range to become much bigger. They will continue to buy unless there is a surprisingly strong reversal down. If the small overnight rally stalls and evolves into a trading range, day traders will also sell rallies, looking for 10 pip scalps.
Summary of today’s S&P Emini futures price action and what to expect tomorrow

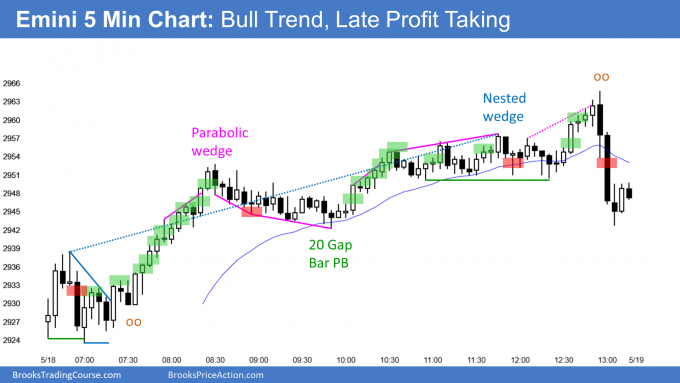
Here are several reasonable stop entry setups for today. I show each buy entry with a green rectangle and each sell entry with a red rectangle. I rarely also show limit order entries and entries on the close of bars. I do not want the lines to be distracting. If they are longer, I make them dotted. But, they have to be visible, so I make the shorter ones solid. Buyers of the Brooks Trading Course and Encyclopedia of Chart Patterns have access to a much more detailed explanation of the swing trades for each day (see Online Course/BTC Daily Setups).
My goal with these charts is to present an Always In perspective. If a trader was trying to be Always In or nearly Always In a position all day, and he was not currently in the market, these entries would be logical times for him to enter.
If the risk is too big for your account, you should wait for trades with less risk or trade an alternative market like the Micro Emini.
End of day summary
The Emini today had a huge gap up and it rallied to above the April high. That triggered a monthly High 1 buy signal. It also ran the stops on the bears who wanted the wedge top on the daily chart to lead to a reversal down. As strong as the rally was, there was late profit-taking and the Emini closed back at the April high.
The rally will probably continue up to at least a little above the 200 day moving average, which is around the 3,000 Big Round Number. However, after a huge breakout like this, the Emini often sideways for 2 – 3 days before resuming up.
It should get above the 200 day moving average and it might reach the March 3 high. That is the sell zone, between 3,000 and 3,100. It should then pull back to around 260 starting within a few weeks.
See the weekly update for a discussion of the price action on the weekly chart and for what to expect going into next week.
Trading Room
Traders can see the end of the day bar-by-bar price action report by signing up for free at BrooksPriceAction.com. I talk about the detailed S&P Emini futures price action real-time throughout the day in the BrooksPriceAction.com trading room. We offer a 2 day free trial.
Charts use Pacific Standard Time
When I mention time, it is USA Pacific Standard Time (the Emini day session opens at 6:30 am PST, and closes at 1:15 pm PST). You can read background information on the intraday market reports on the Market Update page.
Please could you comment why not taking a long on the third bar BO of 2nd bar high? Since the signal bar is a bull bar although weak (doji) but the second bar is a big bar closing near high.
Sometimes I see you will take a long at the open similar to this pattern and sometimes wait for reversal. Any specific guidelines?
Thanks.
Danny, I’m guessing he didn’t take the long after the 2nd bar was because the emini was up around 80 points and given the context you would expect at least a small reversal from so far above the MA.
Yes, that is correct. 80 points up with a doji 1st bar is not good enough for me to pay far above the average price (the 20 bar EMA). If both 1 and 2 or 2 and 3 closed on their highs, I might have taken that. Plus, when I am talking on the open, I typically will only take trades that are very strong.
What do you think about the newly developed vaccine by Moderna?
The most important thing about it is that it increases the chance that there will be an effective vaccine, which is what was likely. However, I think the rally will end at the March 3 high around 3100. The consensus at that time will be that the vaccine will take much longer to become available than in January. The disappointed bulls will take profits and the bears will sell for a reversal down at least to the bottom of the month-long trading range.
My RTY short is becoming painful.