Emini and Forex Trading Update:
Monday November 2, 2020
I will update again at the end of the day.
Pre-Open market analysis
The Emini reversed up on Friday from just above the September low. It is therefore a buy signal bar for a double bottom. But because it had a bear body, it is a weak buy setup. There might be more sellers than buyers above its high. But the Emini is oversold and at the support of the bottom of a 3-month trading range. It could therefore bounce at any time. However, the bears will probably sell the 1st 2 to 3-day bounce.
On the monthly chart, October was a bear inside bar, and it followed an outside down bar in September. October is therefore a sell signal bar for an ioi breakout mode top.
The Emini is at the top of a 3-year trading range and it is now reversing down for the 2nd time in 3 months. The Emini will probably trade below the October low this month, which would trigger the monthly sell signal.
This could happen today but that is unlikely. If it does trigger the monthly sell signal this month, the Emini does not have to collapse. But it would increase the chance of a break below the September low, which is the neckline of the September/October double top.
The bears want a measured move down, which would be back to the middle of the 3-year trading range, just below 2900. However, when a monthly signal triggers, there is usually a pullback. Traders will decide if the Emini will continue down or reverse up.
With all of the trading range trading lately, traders will expect more today. But the location is important. When the market is at major support like the September low, there is always an increased chance of a big trend up or down.
Overnight Emini Globex trading
The Emini is up 36 points in the Globex session. It will gap far above Friday’s close and it might gap above Friday’s high. A gap above Friday’s high would create a 3-day island bottom, which is a minor buy signal.
Since there is a parabolic wedge sell climax on the daily chart, traders should expect at least a couple small legs sideways to up this week. The bears will look for a Low 2 bear flag just below the EMA and then a break below the September low. The bulls want the reversal up to continue to the October 12 lower high and then a new all-time high.
Since there is a good sell signal on the monthly chart, today’s buy signal should lead to a minor rally. Traders will then look for a break below the October low in a couple weeks.
With the daily chart oversold and at support, there is an increased chance of a bull trend day today. However, Friday had a bear body. That is therefore a weak buy signal bar. Also, there is uncertainty about tomorrow’s US election. That further reduces the chance of a strong rally today. Finally, even when there were big trend days during the 3-week selloff, the Emini spent several hours going sideways. These factors increase the chance of a lot of trading range trading today, even if there is a trend.
Can the trend be down? Of course, but if there is a trend today, up is more likely because Friday was a reversal up from a double bottom and a parabolic wedge selloff.
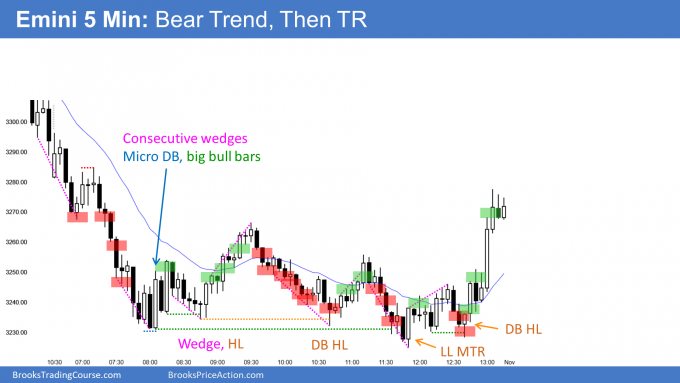
Friday’s setups

Here are several reasonable stop entry setups from Friday. I show each buy entry with a green rectangle and each sell entry with a red rectangle. I rarely also show limit order entries and entries on the close of bars. I do not want the lines to be distracting. If they are longer, I make them dotted. But, they have to be visible, so I make the shorter ones solid. Buyers of both the Brooks Trading Course and Encyclopedia of Chart Patterns have access to a much more detailed explanation of the swing trades for each day (see Online Course/BTC Daily Setups).
My goal with these charts is to present an Always In perspective. If a trader was trying to be Always In or nearly Always In a position all day, and he was not currently in the market, these entries would be logical times for him to enter.
If the risk is too big for your account, you should wait for trades with less risk or trade an alternative market like the Micro Emini.
EURUSD Forex market trading strategies

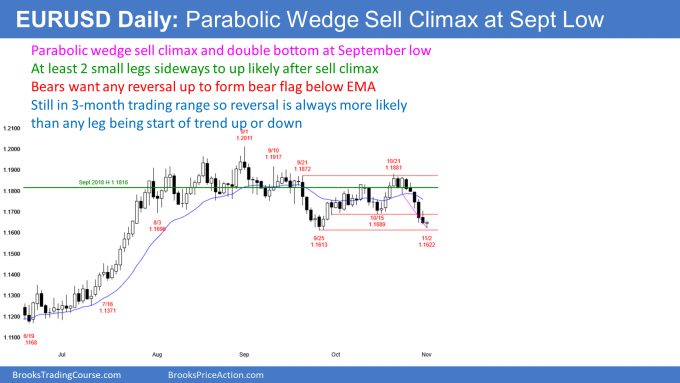
The EURUSD Forex market on the daily chart has sold off for a couple weeks. But the selloff has had 3 small legs in a tight bear channel. It is therefore a parabolic wedge.
Since the today’s reversal attempt is at the September low, there is a wedge bottom forming a double bottom. This is a common reversal pattern. A sell climax typically will lead to profit-taking. There should be at least a couple small legs sideways to up this week.
The bears will want them to form a Low 2 bear flag below the EMA. They then want the bear trend to resume and break below the September low. However, the bulls are hoping that the reversal will grow in to a swing up to the October 21 high and then above the September high.
Since the 2 week selloff is in an 8-bar bear micro channel and there is a wedge top on the weekly chart, traders ultimately expect a test down to the June 25 high at around 1.14. But the chart has been in a trading range for 3 months. This could continue much longer before there is a breakout in either direction.
I mentioned over the weekend that the monthly chart had an ioi pattern and that November would probably trade below the October low. Well, it did overnight, and this triggered a monthly sell signal.
When a signal triggers on a higher timeframe, there is an immediate pullback about half the time. This is an example. Then, traders decide if the sell signal will succeed or fail. The weekly chart makes traders believe that the EURUSD will likely work lower for a couple months.
Overnight EURUSD Forex trading
The 5-minute chart of the EURUSD Forex market broke below the October low, which triggered the monthly ioi sell signal. However, it has been sideways in a 35-pip range. Traders are deciding if the monthly sell signal will succeed or fail.
With the overnight range being so small, day traders are scalping reversals up and down for 10 pips. Since the location is very important on the daily chart, there is an increase chance of a trend, which can be up or down. But will so little energy, today will probably remain small.
The fight will be over how the day closes. The bulls want today to be a buy signal bar on the daily chart. They therefore want today to close near its high. That would increase the chance of higher prices tomorrow.
The bears, however, want today to close on the low and below the October low. Traders would then expect lower prices tomorrow.
Summary of today’s S&P Emini futures price action and what to expect tomorrow

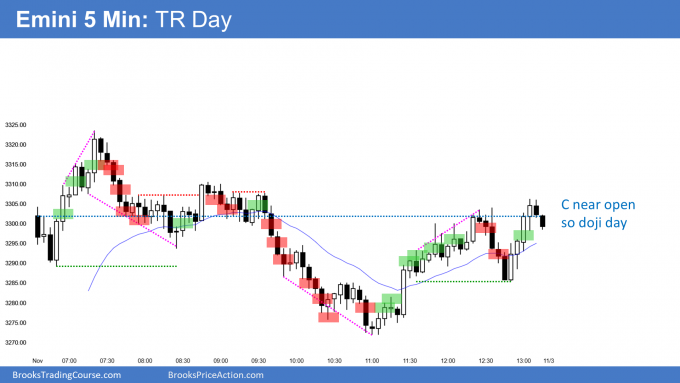
Here are several reasonable stop entry setups for today. I show each buy entry with a green rectangle and each sell entry with a red rectangle. I rarely also show limit order entries and entries on the close of bars. I do not want the lines to be distracting. If they are longer, I make them dotted. But, they have to be visible, so I make the shorter ones solid. Buyers of both the Brooks Trading Course and Encyclopedia of Chart Patterns have access to a much more detailed explanation of the swing trades for each day (see Online Course/BTC Daily Setups).
My goal with these charts is to present an Always In perspective. If a trader was trying to be Always In or nearly Always In a position all day, and he was not currently in the market, these entries would be logical times for him to enter.
If the risk is too big for your account, you should wait for trades with less risk or trade an alternative market like the Micro Emini.
End of day summary
The Emini gapped up and rallied, but sold off from a parabolic wedge top to a little more than a measured move down from the high to the open. That made a trading day likely. There was a wedge bottom at yesterday’s close and then a rally back to the open. Today was a doji bar on the daily chart.
The bears see today as a double top bear flag with Thursday high. They want a selloff to below last week’s low, which was the October low. That would trigger the ioi sell signal on the monthly chart.
However, the Emini is at the bottom of a trading range of the daily chart. In addition, today triggered a parabolic wedge buy signal on the daily chart. Also, it might take several days before the election results come out. That uncertainty increases the chance of more sideways trading.
See the weekly update for a discussion of the price action on the weekly chart and for what to expect going into next week.
Trading Room
Traders can see the end of the day bar-by-bar price action report by signing up for free at BrooksPriceAction.com. I talk about the detailed S&P Emini futures price action real-time throughout the day in the BrooksPriceAction.com trading room. We offer a 2 day free trial.
Charts use Pacific Standard Time
When I mention time, it is USA Pacific Standard Time (the Emini day session opens at 6:30 am PST, and closes at 1:15 pm PST). You can read background information on the intraday market reports on the Market Update page.