Emini nested buy climaxes above 2825 resistance
I will update again at the end of the day.
Pre-Open market analysis
Friday completely reversed Thursday’s rally. Thursday was a buy climax. It followed an 8 bar bull micro channel, which is a bigger buy climax. Both are late in a 3 month buy climax. This is a set of 3 nested buy climaxes and it is therefore a parabolic wedge.
The context is good for the bears. There is a micro double top for a failed breakout above the 2018 triple top on the daily chart. The daily chart has been in a trading range for 16 months, and therefore failed breakouts are common. Finally, 80% of years have at least 2 months in the opposite direction.
Last week is a credible setup for the start of a 1 – 2 month sideways to down move. On the weekly chart, last week is a sell signal bar for a Low 2 rally. If the bears begin to get bear bars closing on their lows this week, the probability will go up.
If a 2 month selloff is beginning, it is coming after a parabolic wedge top. A selloff from a parabolic wedge often comes in the form of an Endless Pullback. That is a bull flag that just keeps adding bars. The market continues to drift down for 20 or more bars, looking like a bull flag, yet not resuming up. Then, after about 20 bars, there is a breakout up or down.
This week is important
What takes place this week will give traders clues about what the next 2 months will do. If the bulls quickly resume their rally and break above last week’s high, the odds will favor a new all-time high without much of a pullback beforehand. But, if the bears begins to get many bear bars, especially big bars closing on their lows, the odd will favor 1 – 2 months down, possibly to 2600 or lower.
When the bulls and bears both have credible expectations, the Emini usually has to go sideways for a few days before it decides on its direction. Unless the bulls quickly resume the rally, the odds will begin to shift in favor of the bears.
Overnight Emini Globex trading
The Emini is down 4 points in the Globex session. Despite Friday’s strong reversal down, the bears need to break strongly below last week’s low to make traders believe that a swing down is beginning on the weekly chart.
There is no big bear bar on the daily chart breaking far below a support level. Therefore, the bulls have not yet given up. They hope that Friday was simply a pullback to the 20 day EMA.
This week will be important. At the moment, the odds favor at least a small 2nd leg down after Friday’s bear trend reversal. That means that traders expect a rally today or tomorrow.
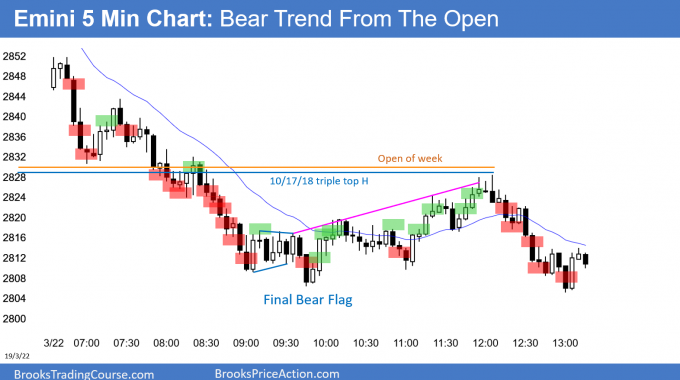
Friday was in a trading range for the final 4 hours. The top of the range is just a few ticks below the October high of 2828.75. That has been resistance for 16 months and it is therefore a magnet early this week.
Since last week formed a good sell signal bar on the weekly chart, its low is also a magnet. Finally, Friday’s 4 hour trading range was an expanding triangle. That further increases the odds of more sideways trading. Consequently, the Emini might be mostly sideways today between 2800 and 2830.
Friday’s setups

Here are several reasonable stop entry setups from Friday. I show each buy entry with a green rectangle and each sell entry with a red rectangle. I rarely also show limit order entries and entries on the close of bars. My goal with these charts is to present an Always In perspective. If a trader was trying to be Always In or nearly Always In a position all day, and he was not currently in the market, these entries would be logical times for him to enter.
EURUSD Forex market trading strategies

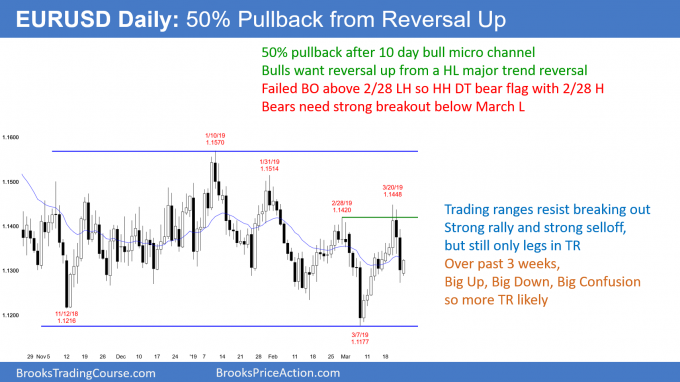
The EURUSD daily Forex chart rallied for 10 days in a bull micro channel. It sold off sharply for 2 days last week. Whenever a market reverses down sharply after reversing up sharply, there is confusion (Big Up, Big Down creates Big Confusion). Confusion is a hallmark of a trading range.
I wrote on Friday the the daily chart would probably be sideways for several days this week. So far, today is a bull bar that is inside Friday’s range. It is within the 3 day tight trading range from 6 days ago. That increases the chance of more sideways trading today and tomorrow. The chart might enter a tight trading range while it waits for more Brexit news.
The bulls want the 2 day selloff to be a higher low major trend reversal. And it might be. They need today to close near its high to be a credible buy signal bar for tomorrow. Furthermore, they expect a 2nd leg sideways to up after a wedge bottom and a bull micro channel.
However, 2 days down is typically not enough to lead to a major reversal. Furthermore, even a perfect major reversal pattern only has a 40% chance of a swing up. Finally, every strong leg up and down for 4 months reversed. Therefore, a swing up would still probably not break far above the 4 month range. Trading ranges have a strong propensity to continue.
Overnight EURUSD Forex trading
The EURUSD 5 minute Forex chart has rallied 35 pips overnight. However, there was a 20 pip pullback in the rally. While the daily chart has a bull trend bar, the 5 minute chart is in a bull channel. It has also been in a trading range for 5 hours.
The bulls need a strong breakout above the high from 3 hours ago. However, today’s bars are not big and many have prominent tails. This is trade action price action, and it reduces the chance of a big trend today. More likely, today might rally a little further, like up to Thursday’s low.
The bulls will continue to buy pullbacks because they want today to close on its high. That would make it a stronger buy signal bar for tomorrow on the daily chart.
Since the bears always want the opposite and the chart has been sideways for 5 hours, the bears will continue to sell rallies. Neither is looking for a trend at the moment. Day traders have been scalping for about 10 pips.
Summary of today’s S&P Emini futures price action and what to expect tomorrow

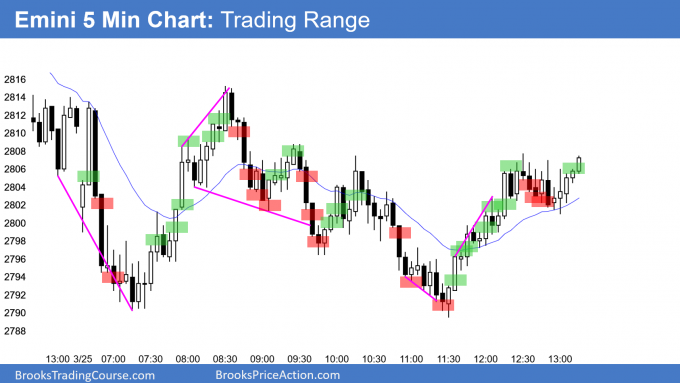
Here are several reasonable stop entry setups for today. I show each buy entry with a green rectangle and each sell entry with a red rectangle. I rarely also show limit order entries and entries on the close of bars. My goal with these charts is to present an Always In perspective. If a trader was trying to be Always In or nearly Always In a position all day, and he was not currently in the market, these entries would be logical times for him to enter.
End of day summary
By trading below last week’s low, the Emini triggered the weekly sell signal today. However, the Emini is at support at the 2800 Big Round Number and the 20 day EMA. Today was a trading range day and therefore not a strong entry day for the bears.
Because today closed just above the open, it is a weak buy signal bar for tomorrow on the daily chart. But, Friday’s reversal down was strong enough to have at least a small 2nd leg down. Consequently, if there is a rally this week, it will probably form a lower high.
See the weekly update for a discussion of the price action on the weekly chart and for what to expect going into next week.
Trading Room
Traders can see the end of the day bar-by-bar price action report by signing up for free at BrooksPriceAction.com. I talk about the detailed S&P Emini futures price action real-time throughout the day in the BrooksPriceAction.com trading room. We offer a 2 day free trial.
Charts use Pacific Standard Time
When I mention time, it is USA Pacific Standard Time (the Emini day session opens at 6:30 am PST, and closes at 1:15 pm PST). You can read background information on the intraday market reports on the Intraday Market Update page.
Hey Al,
Did you hear about the new Micro E-mini futures coming out in May?!
So good. I think it’s going to help out a lot of traders.
Hi Al. I’ve been a fan of yours so far back that I had to PRE-order your first book, Bar-by-Bar. I’m a forex trader so I’m not a room member, but I frequently buy a month of recordings. I’ve never heard you answer this question though. If you have, could you or someone direct me to the answer?
How do you manage your personal accumulated wealth? I don’t mean specific investments, but do you use your chart reading skills to invest long-term, such as with monthly or yearly charts? Do you diversify your money into different categories, etc? If this works better as a stand-alone blog post, I think it would be of interest to a lot of people. Thanks, Al, for all you’ve done for us for so, so long!
I have thought about addressing that. I am a trader and not a financial adviser. I have other investments, but my focus is on trading.
I grew up poor and I believe that every child should have a fair start in life. I did not. I therefore do not believe in inherited wealth. I have talked about this in the chat room a few times over the years. While I will take care of my wife and I will leave something for my kids, I am planning on quietly giving the majority of my money to universities.
My 3 daughters and 2 step sons graduated from Harvard, Stanford, Yale, Berkeley, UCLA, and USC. The 1st 3 schools in this list have $30 billion endowments, and they can never spend what they have. My interest is in the University of California schools.
I do not have an incentive to reach some magic number. Ego is not an issue. My goal is to be a good caretaker of the money while I am still here so that there will be enough to hopefully help some kids later on.
Amen. <3
Thank you Al. If I already didn’t have a decades-worth of evidence of your tireless generosity, this would be a great example. Sincere thanks for all you’ve created and continue to do.
Where do I buy a month of recordings at?
Go to brookspriceaction.com, log in, and click on Subscriptions. You can select the month you want to buy. Most are $50. All the dead air time is removed so each is only about 2hrs for a full trading day. They’re an invaluable resource.