Emini outside down week is starting pullback
I will update again at the end of the day.
Pre-Open market analysis
During yesterday’s strong selloff, I said that there would probably be a reversal up yesterday or today. Yesterday’s early reversal failed, but the bulls will likely try again today. This is because this week is the 1st pullback on the weekly chart. Many bulls are looking to buy the 1st pullback in 10 weeks.
This week’s selloff went far below last week’s low. But yesterday ended with a wedge bull flag on the 60 minute chart. With last week’s low and the 20 day EMA being strong magnets above, there is an increased chance of a rally today.
This is especially true because it is the last day of the week. What the Emini does today affects the appearance of the weekly chart. The bears will probably take profits at some point today. This might happen in the final hour. That short covering rally would put a conspicuous tail on the bottom of this week’s candlestick on the weekly chart. A tail would reduce the bearishness of this week.
Less likely, today will be another strong trend day and close on it low. That would increase the chance of a deeper pullback, maybe to the around 2600 and the November low.
Overnight Emini Globex trading
The Emini is down 19 points in the Globex session. Today will therefore likely gap down. However, the gap down will be the 4th leg down on the 60 minute chart. That is a wedge bear channel, which is a climax pattern.
A sell climax usually results in exhausted bears. They then take some profits. This short covering can be strong. Therefore, there is an increased chance of at least a 2 hour rally at some point today. It could come on the open and last all day. Less likely, today will be another big bear trend day.
Yesterday’s setups

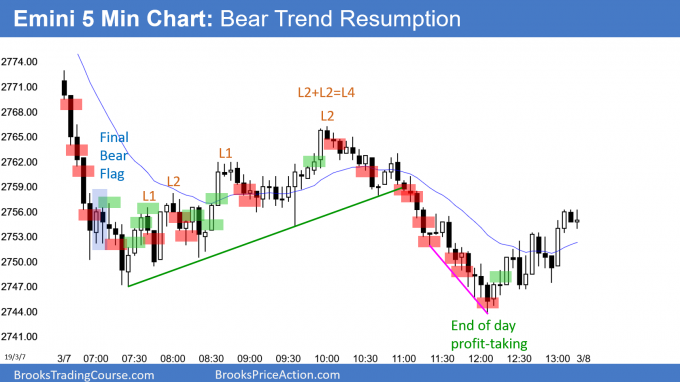
Here are several reasonable stop entry setups from yesterday. I show each buy entry with a green rectangle and each sell entry with a red rectangle. I rarely also show limit order entries and entries on the close of bars. My goal with these charts is to present an Always In perspective. If a trader was trying to be Always In or nearly Always In a position all day, and he was not currently in the market, these entries would be logical times for him to enter.
EURUSD Forex breakout below trading range needs confirmation

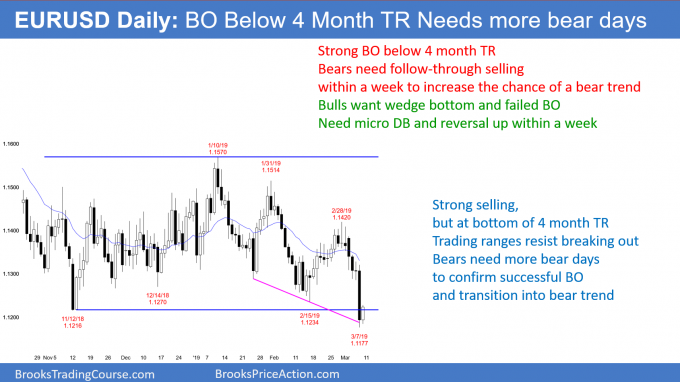
The EURUSD daily Forex chart yesterday formed a big bear bar. It closed below the bottom of the 4 month trading range. But, the bears need additional bear bars to convince traders that the breakout will be successful.
Look at the January 10 high. The day before was a big bull day that broke above what was the top of the range. The breakout failed.
The current situation is similar. If today is a bull day that closes near its high, the bears will exit and bulls will buy above today’s high. That would increase the chance of a failed breakout. Traders would see the 2 month selloff as a wedge bottom.
Even if today closes on its high, the bears can still get a successful breakout. They would then need 2 – 3 bear bars closing near their lows early next week to establish a bear trend.
Consequently, the next few days are important. Will the bulls get 2 – 3 big bull days and reverse the breakout? Or, will the bears get 2 -3 big bear days and convince traders that the trading range has successfully evolved into a bear trend?
Overnight EURUSD Forex trading
So far, today is a bull day on the daily chart. Today’s close is important. The bears want another bear trend day. However, the 5 minute chart has trended up 60 pips in a tight bull channel since yesterday’s low.
Since the channel is tight, the buying is strong. Consequently, the bulls are buying even very small pullbacks. So far, the bears have not been selling. Not even the bear scalpers have been able to make money overnight.
Because yesterday’s selloff was extremely strong, the overnight rally is probably forming a Big Up after a Big Down pattern. That typically creates Big Confusion, which is a hallmark of a trading range. Therefore, today will probably convert into a trading range on the 5 minute chart.
The fight will be over how the day closes. The more it closes on its high, the better today will be as a buy signal bar for Monday. If there is a big tail on top, the bears will be more willing on Monday to sell above today’s high. Monday would then be a Low 1 bear flag on the daily chart.
Summary of today’s S&P Emini futures price action and what to expect tomorrow

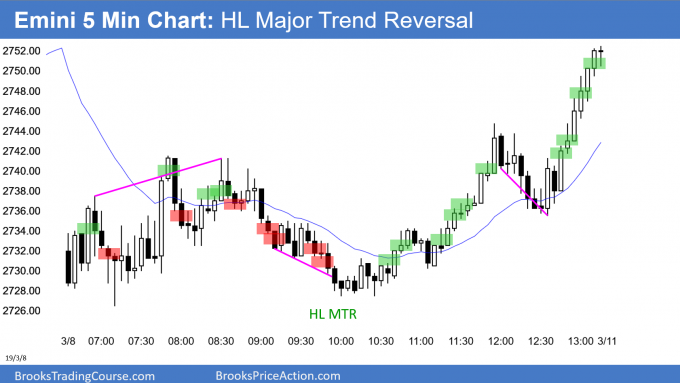
Here are several reasonable stop entry setups for today. I show each buy entry with a green rectangle and each sell entry with a red rectangle. I rarely also show limit order entries and entries on the close of bars. My goal with these charts is to present an Always In perspective. If a trader was trying to be Always In or nearly Always In a position all day, and he was not currently in the market, these entries would be logical times for him to enter.
End of day summary
Today was a trading range day. By closing near its high, is a buy signal bar for next week. It is possible that this is the end of the selloff, but not likely.
The selloff got near the February 11 high, but did not close that gap on the daily chart. Because it is a magnet and nearby, the Emini will probably close it within a week or so.
Furthermore, because this week was a big bear bar on the weekly chart, the odds favor at least slightly lower prices next week. But after a 10 bar bull micro channel, this selloff will probably end within a couple weeks.
What happens if next week is a bull inside bar on the weekly chart? It would be a buy signal bar for the following week. The Emini would then probably break above the October high.
However, the 2 month buy climax is so extreme that a rally from here will probably not get far. The Emini will probably have to go mostly sideways for at least a few weeks before the bulls will become aggressive again.
See the weekly update for a discussion of the price action on the weekly chart and for what to expect going into next week.
Trading Room
Traders can see the end of the day bar-by-bar price action report by signing up for free at BrooksPriceAction.com. I talk about the detailed S&P Emini futures price action real-time throughout the day in the BrooksPriceAction.com trading room. We offer a 2 day free trial.
Charts use Pacific Standard Time
When I mention time, it is USA Pacific Standard Time (the Emini day session opens at 6:30 am PST, and closes at 1:15 pm PST). You can read background information on the intraday market reports on the Intraday Market Update page.
I think there is a way to look at it and it is logical and right to expect to be overwhelmed from start when more informations are included within PA context reading (15, 60, daily chart).
I always felt Al cherry picks especially, when you look at mark trades on chart, it has pretty much 100 % win ratio.
I think cherry picks situation is big issue untill you are able to read context. I think the way around it is to concentrate on one context for example identify MTR, which has more informations and you can recognize more clearly cheery pick behaviour.
Hi Al
On Thursday you marked b1 as a short, but not today
If considering the 5min chart alone, they look close to identical setups
If a trader is trying not to consider other context, do you think they should take both, neither, or is there a distinction I’m missing on the 5min chart?
Thanks
I talked about that in the chat room today at the time. Today was likely to close at least 10 points above its low. Also, the 60 min chart had a wedge bottom. Finally, today’s open was much further below the EMA than yesterday’s, and therefore more oversold.
Thank you for your reply. I watched both Thursday and Friday’s recordings back and understand all the reasons you are able to distinguish based on the HTFs up to weekly, whether options traders are taking profits, etc.
But my brain just gets overwhelmed by all this information, so I’m trying to trade just the chart in front of me, as I know you also advocate
I see your point about Friday being more oversold, but thought Thursdays small gap = more likely to close, so on the visible data alone was unable to distinguish, and am wary of cherry picking
If you don’t mind therefore, I could clarify my question to whether the charts you post here stand alone, or have to be considered in all the bigger context to fully make sense?
Thanks
I have another screen to have 5min charts zoomed-out to at least past five trading days and divided by vertical lines day by day. And on my trading screen I only zoom into today’s on-going 5 min chart. It helps me to identify more clues from the past days but ignore the details from them. I noticed Al has 15min and hourly and daily chart in small windows on his screen. maybe just because people have different ways to process information, but context is definitely very important than single bars and patterns. just personal experiences, hope it helps.
I almost entirely trade the chart in front of me, but at the end of the day, week, or month, I look at those charts as well because that is a time when the 5 min chart will often move because of the higher time frame.
Thank you very much for your clarification.