Emini outside up day after failed Low 2 top
I will update again at the end of the day.
Pre-Open market analysis
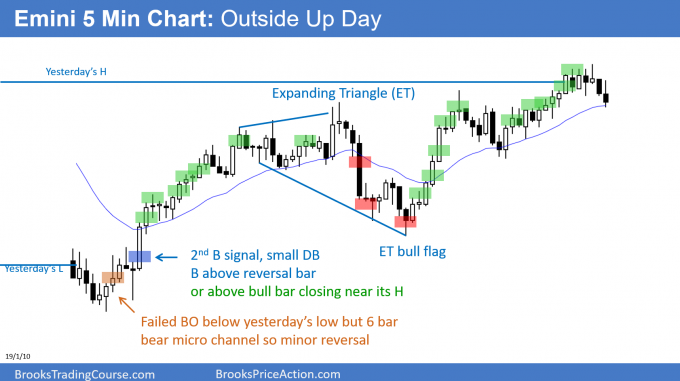
Yesterday triggered a Low 2 sell signal on the daily chart. But, the bulls then rallied to above yesterday’s high and created an outside up day. This is a sign of strength. However, it is also the 3rd push up in a tight bull channel. Therefore, it is a parabolic wedge buy climax. That usually leads to exhausted bulls and a pullback. While there are targets above, especially the November low, the rally will probably stall within a few days.
Outside days often lead to inside days. There is therefore an increased chance that today will reverse down from below yesterday’s high and reverse up from below yesterday’s low.
If today is an inside day, it will be both a buy and sell signal bar for Monday. In an overbought market, traders would then conclude that a reversal down for a few days is more likely than a continued rally.
In addition, since an outside day is a 2 day trading range, there is an increased chance of a 3rd mostly overlapping overlapping day. Consequently, even if today trades above or below yesterday’s range, it probably will not get far.
Because the Emini is now testing the breakout point on the weekly chart, it is in the sell zone. However, the bears will probably need at least a micro double top on the daily chart. Without that, the rally will probably continue up to the November low before the bears will sell.
Overnight Emini Globex trading
The Emini is down 7 points in the Globex market. Since yesterday was a buy climax, traders will expect at least a couple hours of sideways to down trading beginning by the end of the 2nd hour. If they get it, today will probably mostly overlap yesterday, which is likely.
Even if today is a trading range day, the daily ranges are still big. Consequently, there will be at least one swing up or down.
After 3 small days, traders expect that today will probably not be a big trend day up or down.
It is Friday, so traders will pay attention to weekly support and resistance, especially in the final hour. The bulls want the week to close on its high. There is resistance above at the October 2607.00 low and support below at the February 2548.00 low.
Yesterday’s setups

Here are several reasonable stop entry setups from yesterday. I show each buy entry with a green rectangle and each sell entry with a red rectangle. I rarely also show limit order entries and entries on the close of bars. My goal with these charts is to present an Always In perspective. If a trader was trying to be Always In or nearly Always In a position all day, and he was not currently in the market, these entries would be logical times for him to enter.
EURUSD Forex pullback from breakout above 2 month trading range

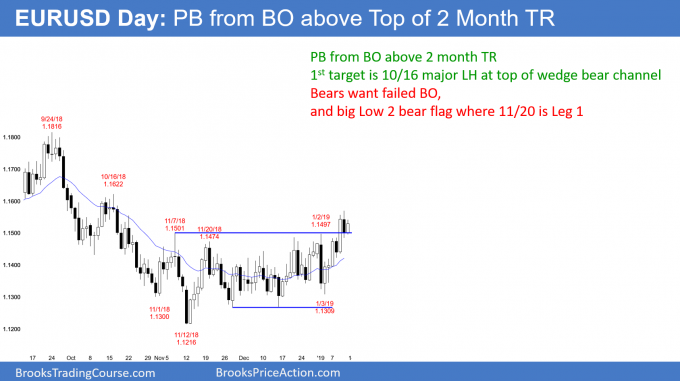
The EURUSD daily Forex chart broke above the top of a 2 month trading range. Yesterday was a bear day and therefore a sell signal bar for a failed breakout. However, the breakout was big enough to make a successful breakout more likely. Consequently, there will probably be more buyers than sellers below yesterday’s low.
Because yesterday was a bear sell signal bar, the bulls are disappointed. Some will exit and wait for a deeper pullback before buying again. This disappointment is a sign that a successful breakout might lead to a weak rally rather than a strong bull trend.
The bulls need to begin to form a series of bull bars closing above their midpoints. If they get that, other bulls will be willing to buy at the market. This would increase the chance of a rally to the 1.17 or 1.18 resistance levels.
The bears got a good bear bar yesterday. However, they need a string reversal down within the next few days. Otherwise, the rally will probably continue up for at least 200 pips.
Overnight EURUSD Forex trading
The EURUSD 5 minute chart reversed up 40 pips overnight from just above yesterday’s low. Therefore, the bulls so far have been able to prevent the sell signal from triggering.
The bulls need signs of strength to convince traders that the breakout is the start of a rally. At a minimum, they need days closing above their midpoints. A sign of a strong bull trend is a series of days closing on their highs.
If today closes near its high and remains an inside day, it will be a buy signal bar on the daily chart for Monday. That is a reasonable goal for the bulls Even though the overnight trading has been in a tight range, the bulls will buy selloffs, trying to get a close near the high.
Because the overnight range has been small, there is no conviction that the price is wrong. Day traders have been scalping. They might be waiting for next week before looking for a swing trade up or down.
Summary of today’s S&P Emini futures price action and what to expect tomorrow

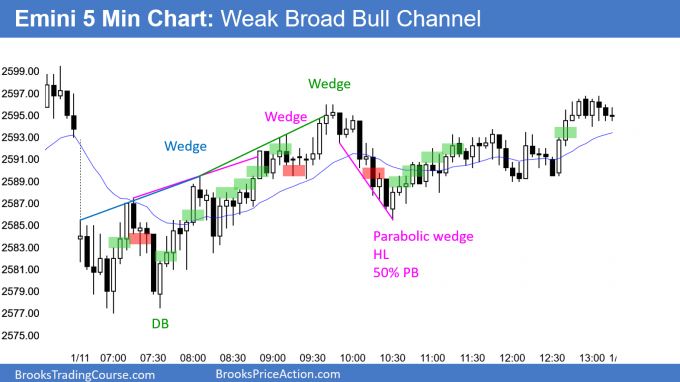
Here are several reasonable stop entry setups for today. I show each buy entry with a green rectangle and each sell entry with a red rectangle. I rarely also show limit order entries and entries on the close of bars. My goal with these charts is to present an Always In perspective. If a trader was trying to be Always In or nearly Always In a position all day, and he was not currently in the market, these entries would be logical times for him to enter.
End of day summary
The Emini formed an inside day today after yesterday was an outside day. This is an ioi Breakout Mode setup for Monday. Because the 3 week rally has been unusually strong, it is a buy climax. Bulls will probably not buy aggressively above today’s high.
Since the 3 week channel is tight, bears will probably not be too eager to sell on a stop below today’s low. With both bulls and bears not acting aggressively, today will probably continue the 4 day tight trading range. But, since the Emini is overbought and at resistance, traders will be ready for a 1 – 3 day pullback at some point next week.
See the weekly update for a discussion of the price action on the weekly candlestick chart and for what to expect going into next week.
Trading Room
Traders can see the end of the day bar-by-bar price action report by signing up for free at BrooksPriceAction.com. I talk about the detailed S&P Emini futures price action real-time throughout the day in the BrooksPriceAction.com trading room. We offer a 2 day free trial.
Charts use Pacific Standard Time
When I mention time, it is USA Pacific Standard Time (the Emini day session opens at 6:30 am PST, and closes at 1:15 pm PST). You can read background information on the intraday market reports on the Intraday Market Update page.
IMPORTANT:
Sorry to remind all that comments are really only for clarifying errors and similar in Al’s posts.
Al really does not have the time to answer detailed questions here, and such queries should be brought up in trading room. Or on BrooksPriceAction.com forum for other traders to reply.
Hope you can understand and appreciate that Al already does an inhuman amount of work here, on the other website, and in his trading room.
Thanks
Richard