Trading Update: Monday July 26, 2021
Emini pre-open market analysis
Emini daily chart
- The Emini on Friday broke to new all-time high (an outside up week) and reached the 4,404 measured move target based on the April through June trading range. It also broke above the 4,400 Big Round Number.
- The next target for the bulls is the top of the channel, which is above the 4,500 Big Round Number.
- There is no sign of a top and traders will continue to buy 1- to 3-day selloffs, even if they are strong, like the one last week.
- A reversal down from here would be from an expanding triangle top on the daily chart. That is a major trend reversal pattern. If there was a strong sell signal bar and a couple big bear bars, the reversal would have a 40% chance of leading to a selloff for a couple weeks.
- On the weekly chart, last week was an outside up week in a Small Pullback Bull Trend. That slightly increases the chance of at least slightly higher prices.
- However, a big bull bar late in a bull trend has an increased risk of leading to a bear bar on the following week.
- On the monthly chart, July so far is the 6th consecutive bull bar. That has not happened in 10 years.
- This is the final week of July. While it is possible that there could be a reversal down to below the open of the month, especially since Wednesday’s FOMC announcement is a potential catalyst, it is more likely that July will be another bull bar.
- A 7th consecutive bull bar would be even more rare. Consequently, August should close below the open of the month.
- Once there is a bear bar on the monthly chart, there would be a parabolic wedge top. Traders would then look for a 15-20% correction over the following 2 months.
Emini 5-minute chart and what to expect today
- Emini is down 11 points in the overnight Globex session.
- While the 4-day rally was extremely strong on the 5-minute and 60-minute charts, it was probably unsustainably strong. That increases the chance of sideways to down trading, which could last up to Wednesday’s FOMC announcement or the end of the month on Friday.
- It also reduces the chance of a big bull day today.
- Friday was a buy climax day. Consequently, there is a 75% chance of at least a couple hours of sideways to down trading beginning by the end of the 2nd hour.
Friday’s Emini setups

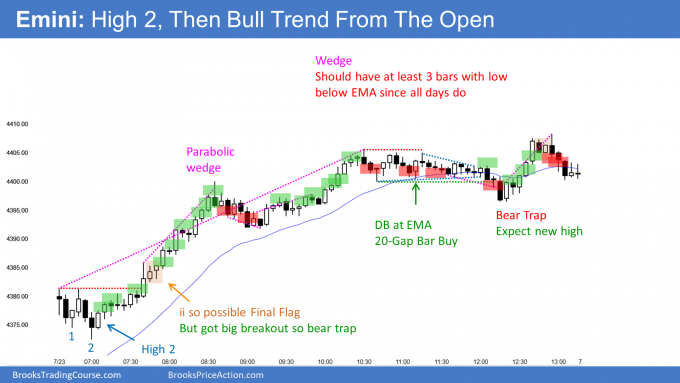
Here are several reasonable stop entry setups from Friday. I show each buy entry with a green rectangle and each sell entry with a red rectangle. Buyers of both the Brooks Trading Course and Encyclopedia of Chart Patterns have access to a much more detailed explanation of the swing trades for each day (see Online Course/BTC Daily Setups).
My goal with these charts is to present an Always In perspective. If a trader was trying to be Always In or nearly Always In a position all day, and he was not currently in the market, these entries would be logical times for him to enter. These therefore are swing entries.
It is important to understand that most swing setups do not lead to swing trades. As soon as traders are disappointed, many exit. Those who exit prefer to get out with a small profit (scalp), but often have to exit with a small loss.
If the risk is too big for your account, you should wait for trades with less risk or trade an alternative market like the Micro Emini.
EURUSD Forex market trading strategies
EURUSD Forex daily chart

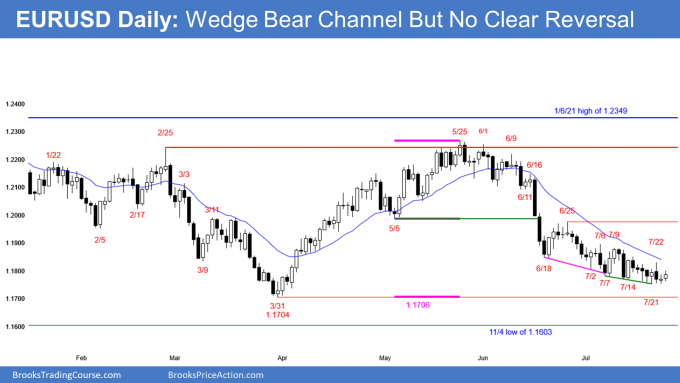
- Today went above Friday’s high, which triggered a buy signal for consecutive wedges, and for a higher low micro double bottom with the July 21 low.
- It is important that today’s low stayed above the July 21 low, which is the current bottom of the wedge. Sometimes a trend begins with a minor low that is easy to overlook.
- However, Friday was a small bull doji bar, which is a weak buy signal bar.
- So far, today is another small bull bar, and it is therefore a weak entry bar.
- The wedge bear channel since June 25 has been tight. It is therefore equally likely that there will be a reversal up or a breakout below the March low.
- 5 sideways days so might continue in a tight trading range up to Wednesday’s FOMC announcement. It is a potential catalyst for a reversal up from the wedge bottom or for a break below the March and November lows.
- Until there is a strong reversal up, the odds favor at least slightly lower prices.
Summary of today’s S&P Emini futures price action and what to expect tomorrow

End of day summary
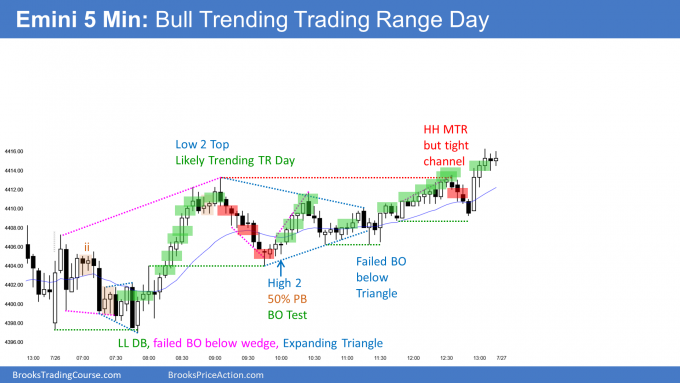
- Trading range open for 1st 19 bars.
- Lower low double bottom, and 2nd leg down was both a wedge and an expanding triangle.
- Strong breakout to new high of day and above last week’s all-time high of Friday.
- But initial trading range was about half of an average day’s range. That made trending trading range more likely than strong bull trend day.
- Reversed down from a Low 2 top and formed upper trading range.
- 2nd half of day was trend resumption up, but of the rally was within the upper trading range.
- Because today closed near its high and it is in a strong 5-day rally, traders expect at least slightly higher prices tomorrow. Tomorrow might gap up.
- After 5 bull days, the bulls might take some profits ahead of Wednesday’s FOMC announcement. This will probably limit the upside tomorrow.
See the weekly update for a discussion of the price action on the weekly chart and for what to expect going into next week.
Trading Room
Traders can see the end of the day bar-by-bar price action report by signing up for free at BrooksPriceAction.com. I talk about the detailed S&P Emini futures price action real-time throughout the day in the BrooksPriceAction.com trading room. We offer a 2 day free trial.
Charts use Pacific Time
When I mention time, it is USA Pacific Time. The Emini day session charts begin at 6:30 am PT and end at 1:15 pm PT which is 15 minutes after the NYSE closes. You can read background information on the market reports on the Market Update page.
A note of interest. The CME will be delisting the full S&P futures and options in September. Any positions will be converted to the emini contract. The Eurodollar options will remain the only floor traded contract.
I knew it was coming but I did not know when.
Thanks,
Al
I wish they would then change the name of the Emini to the S&P, and rename the micro Emini. Mini is a relative term. They chose it in 1997 because it was small compared to the full size contract (20% as big). It will soon be the big contract.
Your markup for today (Monday), doesn’t highlight any trades for the first 18 bars. I believe that these charts are from an always-in perspective and thus geared more for swing traders. I’m wondering though if there were reasonable opportunities for scalpers in the opening range, or should even they have stayed out given the price action on the 5 min at the open?
Just to be correct, the first entry is marked on bar 13.
Ah, true. I suppose you mean the trades implied above and below the ii patterns. Thanks for pointing that out Graeme!
I mean that the first 5 bars are in the previous day (theres a faint separation line 5 bars in). it used to trick me too
Got it. Thanks, again!
Sometimes the best decision is to wait. If a person was looking for a swing trade and a stop entry, which should be what most traders do, there was nothing compelling in that 1st hour. It was better to wait for a breakout or a better setup.
How consistent is the daily take of a good trader? If he makes, say a $1000 day trading the e-mini on average, are there days when this figure would be significantly lower or higher? Are there days when the market exhibits somewhat pathological price action, e.g., a lot of abrupt reversals, where even an expert trader would end up just breaking even or worse? Are good scalpers relatively immune to such variability?
It depends on his style of trading. If he is a scalper, he will have a much smaller standard deviation. If he swing trades on the 15 minute chart, he will have losing days, but he will also have huge winning days.
while doing swing trading based on 1hr or 30min charts i can control my emotions easily and i have enough time to examine the progress of my trade. But during intraday 5min i get easily confused with small minor reversals how can we overcome this?
in early days of your carrier did you trade stocks instead of emini?
When I started back in the 1980’s, there was no Emini. There was only the S&P futures contract, and it was traded by people in the pit. I traded that, commodities, stocks, currencies, and options.
When a trader sees what he should do but doesn’t do it, it is usually because of a fear of loss. I think a good approach is to trade small (the “I don’t care” size that I discuss in the course), like a micro Emini. The goal is to develop skill and confidence. Once a trader has that, he can increase his position size and then the goal is to make a living as a trader.
thank you so much for your reply.